Social Media


Popular formats


Popular features
Photo

Filters
Stock videos of Wykresy
Find the right royalty-free footage and animations with Wykresy for commercial use.


Animated line, bar charts in business plan presentation showing company growth


Circle cylinder pie chart and various graph chart for presentation templete(included alpha)


Business Statistics, Market Data And Infographics Layout/ 4k animation of a set of design business and market data analysis and reports, with infographics, bar stats, charts and diagrams


Stock market investment trading. Business infographic charts and graphs. Abstract financial chart with uptrend line. Success and growth concepts.


Business infographics with diagram loop animation. Charts and graphs. Business success and financial concepts. Presentation template. Data visualization elements.


Circle cylinder pie chart and various graph chart for presentation templete(included alpha)


Circle cylinder pie chart and various graph chart for presentation templete(included alpha)

Business people analyze statistical reports, growth charts on the desktop. Brainstorming, planning the development of the company's strategy. Team meeting


Tablet, documents and people hands in data analysis, charts and graphs of business growth, budget or finance. Financial planning, spreadsheet or statistics strategy of woman, team or partner in above.


Stock market investment trading. Business infographic charts and graphs. Abstract financial chart with uptrend line. Success and growth concepts.


Stock market charts on a white background.


Two young caucasian business professionals having a conversation in modern office, charts and diagrams background


Circle cylinder pie chart and various graph chart for presentation templete(included alpha)


Business infographics with diagram loop animation. Charts and graphs. Business success and financial concepts. Presentation template. Data visualization elements.


Multicolored stickers and business charts on white board with text. Adhesives for business presentation financial audit and task management.


Circle cylinder pie chart and various graph chart for presentation templete(included alpha)


Stock market investment trading. Business infographic charts and graphs. Abstract financial chart with uptrend line. Success and growth concepts.


Stock market investment trading. Business infographic charts and graphs. Abstract financial chart with uptrend line. Success and growth concepts.

Circle cylinder pie chart and various graph chart for presentation templete(included alpha)


Circle cylinder pie chart and various graph chart for presentation templete(included alpha)


Dashboard infographic animation in motion graphics 2d with statistics graphs. Pie charts, workflow, and UI elements.


Analysis and selection of data from charts and tables on the screen modern technologies of trading and investment evaluation. The stock market and the game on the stock exchange


Close up of Businessman Studying Charts while Holding Pen


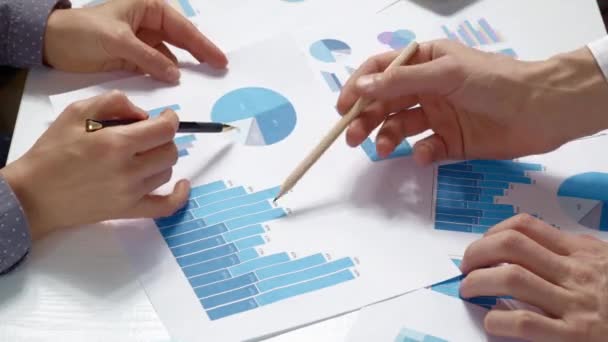
Close up of hands of three business colleagues standing at whiteboard with charts and discussing them. One businesswoman holding smartphone and the other holding notebook and pen


Businessman working in the office with the charts


Financial manager looks growth of sales. Secretary sorts documents. Charts of sales on the office table.


Stock market investment trading. Business infographic charts and graphs. Abstract financial chart with uptrend line. Success and growth concepts.


Paperwork - man analyzing financial reports in office


Business Statistics, Market Data And Infographics Layout/ 4k animation of a set of design business and market data analysis and reports, with infographics, bar stats, charts and diagrams


Business Statistics, Market Data And Infographics Layout Pack/ 4k animation of a set of design business and market data analysis and reports, with infographics, bar stats, charts and diagrams


Analysis and selection of data from charts and tables on the screen modern technologies of trading and investment evaluation. The stock market and the game on the stock exchange


Stock market investment trading. Business infographic charts and graphs. Abstract financial chart with uptrend line. Success and growth concepts.

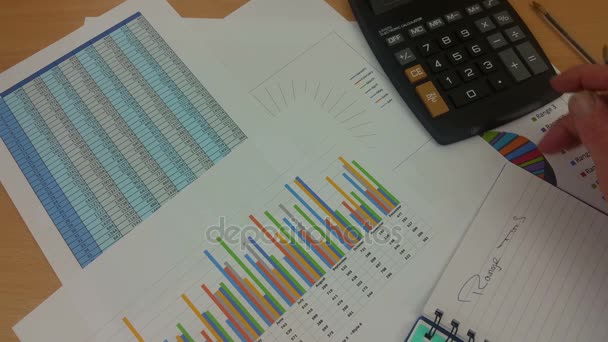
Accountant at his desk using a calculator and reviewing a spread sheet printout while taking notes

Business infographics with diagram loop animation. Charts and graphs. Business success and financial concepts. Presentation template. Data visualization elements.


Several color graphs animated on the white background.


Business analysis - man working with financial data charts and graphs at office


Futuristic graphs and charts, futuristic user screen interface with graphs, lines, surfaces, motional and colorful diagrams, animated dashboard, marketing and information technologies. High quality 4k


Circle cylinder pie chart and various graph chart for presentation templete(included alpha)


Futuristic game target. Aiming and military. Aim of sniper weapon.Monochrome digital display. Future radar screen. Technology concept. Camera recording viewfinder. Game control interface element.


Businessman working in the office with the charts


Stock market investment trading. Business infographic charts and graphs. Abstract financial chart with uptrend line. Success and growth concepts.


Circle cylinder pie chart and various graph chart for presentation templete(included alpha)


Business colleagues discussing paperwork chart reports at office


Stock market investment trading. Business infographic charts and graphs. Abstract financial chart with uptrend line. Success and growth concepts.

Businessman working in the office with the charts


Top view footage of corporate financial team analyzing charts and diagrams with market sales. Brainstorming meeting in the office


Close up of analysis documents with data charts on desk. Business people using papers and digital tablet for marketing strategy with project presentation. Colleagues planning design


Animated dashboard, marketing and information technologes, futuristic user screen interface with graphs, motional and colorful diagrams, charts. High quality 4k footage


Stock market investment trading. Business infographic charts and graphs. Abstract financial chart with uptrend line. Success and growth concepts.


Female hands hold graphic charts. Female employees hands holding charts. Comparing levels of productivity. It was a difficult year.