Social Media


Popular formats


Popular features
Photo

Filters

Stock vector images of Συνέχιση
Discover royalty-free, professionally-designed vector art of Συνέχιση for personal and commercial use.

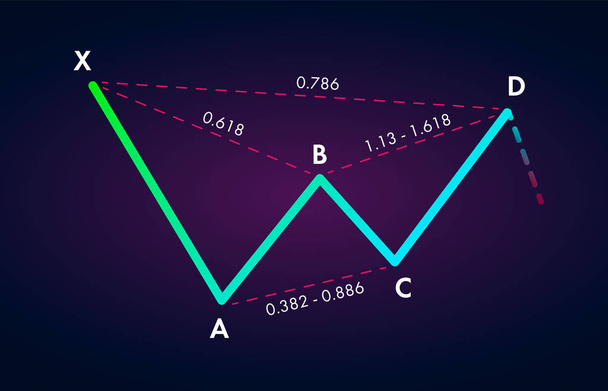
Bullish AB-CD - Harmonic Patterns with bullish formation price figure, chart technical analysis. Vector stock, cryptocurrency graph, forex analytics, trading market price breakouts icon

Rising and Falling Wedge chart pattern formation - bullish or bearish technical analysis reversal or continuation trend figure. Descending and Ascending wedge crypto graph, forex, trading market.

Mutation of the coronavirus. Continuation of the epidemic - covid-20.

Vector illustration of human, athlete depicted as DNA symbol continuation and created with wireframe connections. Bioengineering and genetics concept.

Woman with closed eyes meditating in yoga lotus posture. The girl is doing her favorite hobby

Japanese trading chart with rising and falling candlesticks and RSI indicator, symbolizing use technical analysis in online stock, crypto trading and importance of monitoring market trends.
Bearish Rectangle - continuation price chart pattern figure technical analysis. Strong uptrend between two parallel levels. Stock, cryptocurrency graph, forex analytics, trading market breakouts icon

Rectangle Pattern (-) Green & Red

Rectangle Pattern (-) White & Black
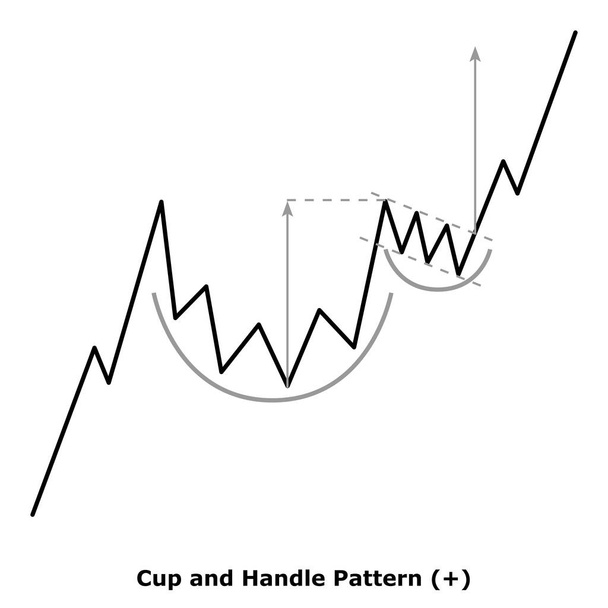
Cup and Handle Pattern (+) White & Black
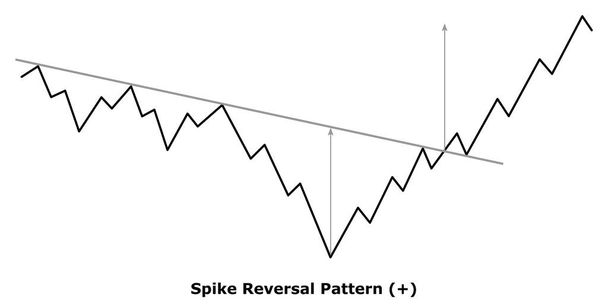
Spike Reversal Pattern (+) White & Black
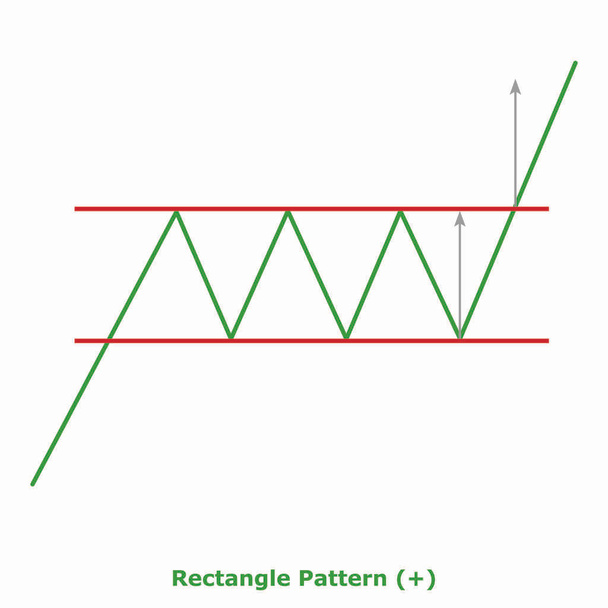
Rectangle Pattern (+) Green & Red

Head and Shoulders Pattern (-) Green & Red
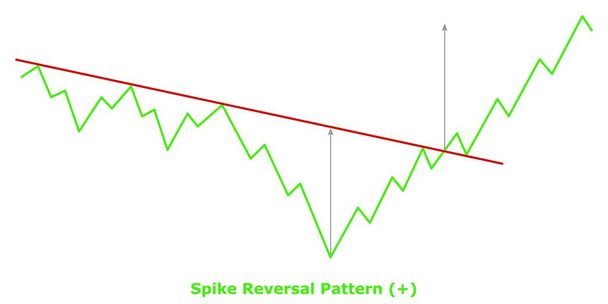
Spike Reversal Pattern (+) Green & Red

Triple Bottom Pattern (+) White & Black

Seamless geometric pattern with striped black white background. Vector illusive background. Futuristic vibrant design.

Alphabet letter in word duration on crossword puzzle background
Landmark place icon and road for creating map vector

Bullish AB-CD - Harmonic Patterns with bullish formation price figure, chart technical analysis. Vector stock, cryptocurrency graph, forex analytics, trading market price breakouts icon
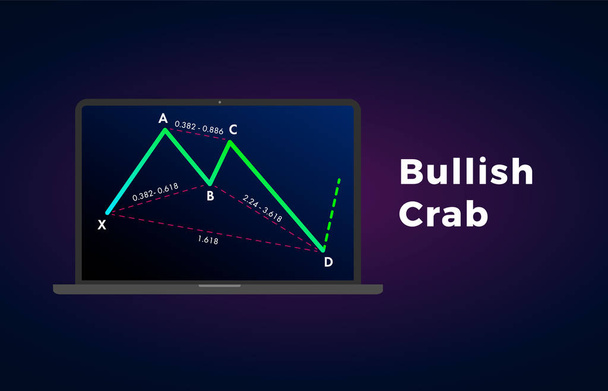
Bullish Crab - Harmonic Patterns with bullish formation price figure, chart technical analysis. Vector stock, cryptocurrency graph, forex analytics, trading market price breakouts icon
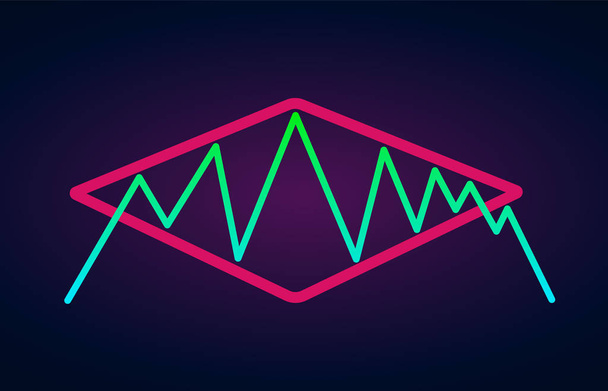
Diamond pattern - bearish formation continuation figure, chart technical analysis. Vector stock, cryptocurrency graph, forex analytics, trading market price breakouts icon

Cup and Handle - bullish continuation price chart pattern figure technical analysis. Stock, cryptocurrency graph, forex analytics, trading market breakouts icon
Purse with credit cards and other icon in cartoon,monochrome style.gift sale of things, button more icons in set collection.

Vector illustration of human, athlete depicted as DNA symbol continuation and created with wireframe connections. Bioengineering and genetics concept.
Next button - Vector flat minimal icon

Business infographic 3D. Abstract background. Vector Illustration

Vector illustration of athletic man made as continuation of tree with roots, Strong heart is good health, wellness center abstraction
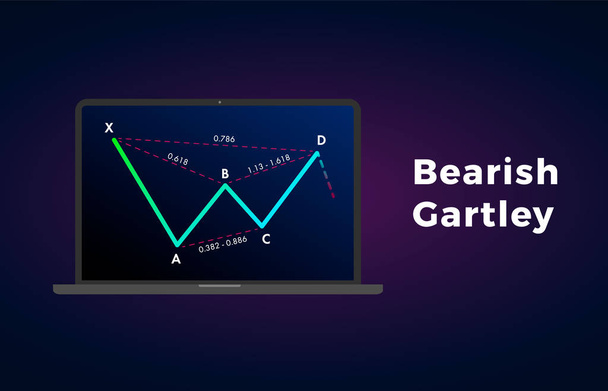
Bearish Gartley - Harmonic Patterns with bearish formation price figure, chart technical analysis. Vector stock, cryptocurrency graph, forex analytics, trading market price breakouts icon

Elderly woman with closed eyes meditating. Meditation practice. The concept of zen and harmony.

Flag Pattern (-) White & Black

Descending Triangle Pattern (-) Green & Red

Elderly woman with closed eyes meditating in yoga lotus posture. April is Stress Awareness Month.

The design of a seamless vector presentation using squares and hexagons. To a seamless geometric pattern to create an endless background. By using a color gradient and use a black background.
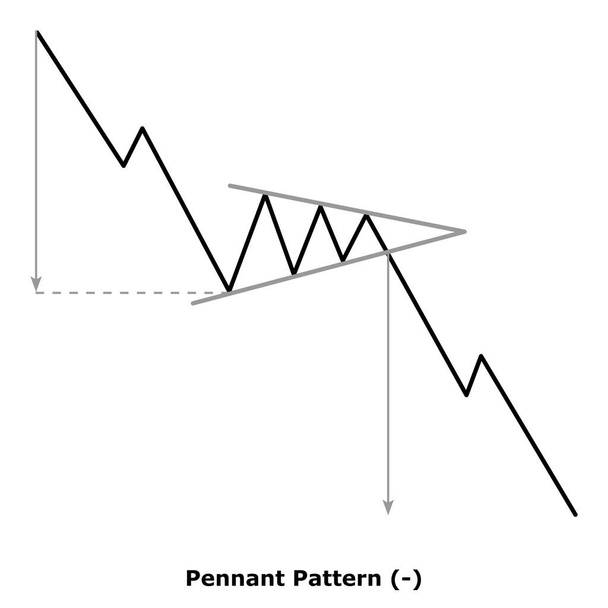
Pennant Pattern (-) White & Black
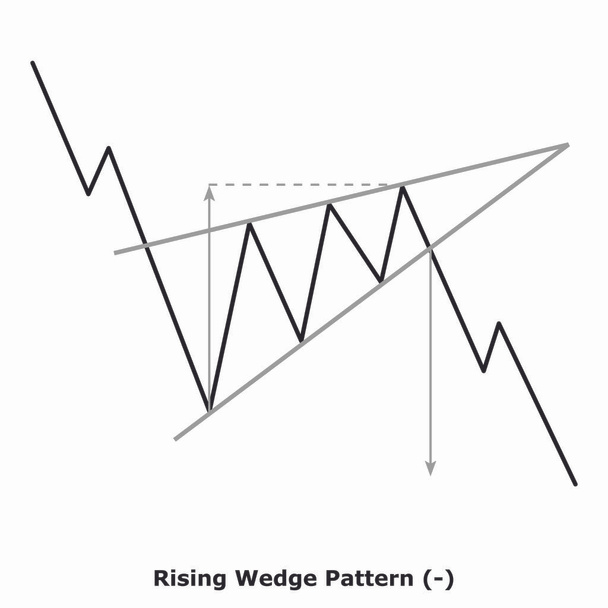
Rising Wedge Pattern (-) White & Black
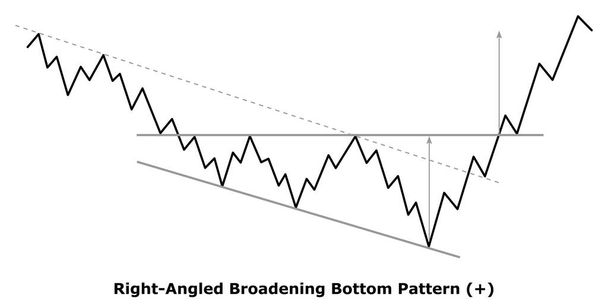
Right-Angled Broadening Bottom Pattern (+) White & Black
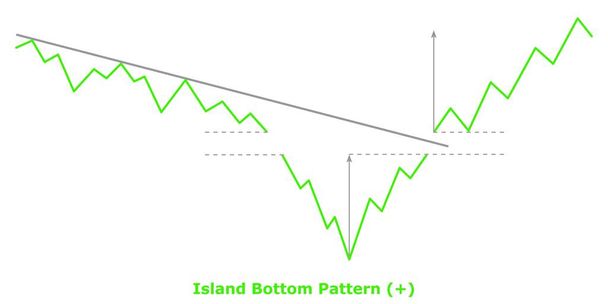
Island Bottom Pattern (+) Green & Red
"Flat icon of graphical symbol of movement, rotation, cyclic recurrence"
Bullish Rectangle - continuation price chart pattern figure technical analysis. Strong uptrend between two parallel levels. Stock, cryptocurrency graph, forex analytics, trading market breakouts icon
Support level line flat icon - chart pattern figure technical analysis. Vector stock and cryptocurrency exchange graph, forex analytics, trading market price.
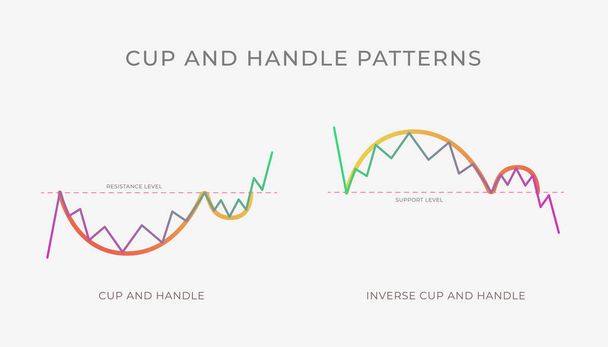
Cup and Handle chart pattern formation - bullish or bearish technical analysis reversal or continuation trend figure. Vector stock, cryptocurrency graph, forex, trading market price breakouts icon.
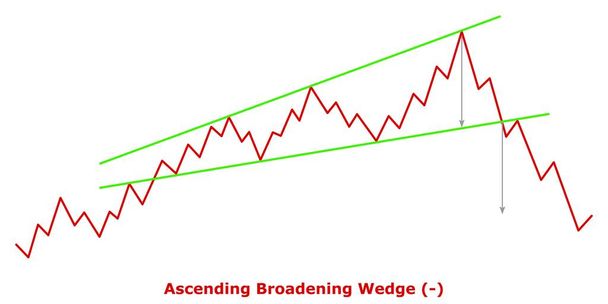
Ascending Broadening Wedge (-) Green & Red

Abstract seamless pattern. with Stripes, lines. Geometric vector background. Black and white texture. Graphic modern pattern.

Seamless pattern with striped black white straight lines and diagonal inclined lines. Optical illusion effect. Geometric op art style. Vector illusive background for cloth, textile, print, web.

Diamond chart pattern formation - bullish or bearish technical analysis reversal or continuation trend figure. Vector stock, cryptocurrency graph, forex analytics, trading market price breakouts icon.
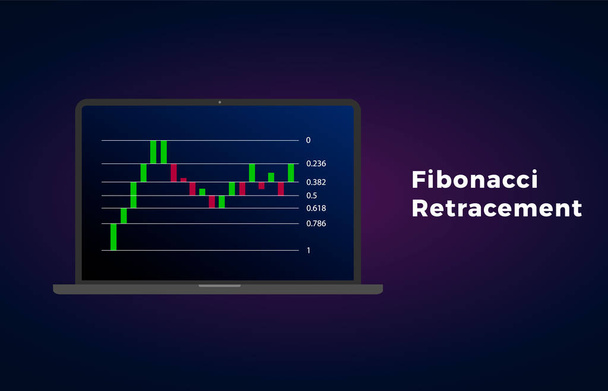
Fibonacci Retracement - technical analysis for determining support and resistance levels. Horizontal line on the Price Chart patterns. Stock, cryptocurrency graph, forex, trading market price breakout
Flat and isolated vector illustration icon with minimal modern design and long shadow

Head and Shoulders Pattern (-) White & Black

Cup and Handle Pattern (+) Green & Red

Business continuity and disaster recovery flat style illustration
Bearish Rectangle - continuation price chart pattern figure technical analysis. Strong uptrend between two parallel levels. Stock, cryptocurrency graph, forex analytics, trading market breakouts icon
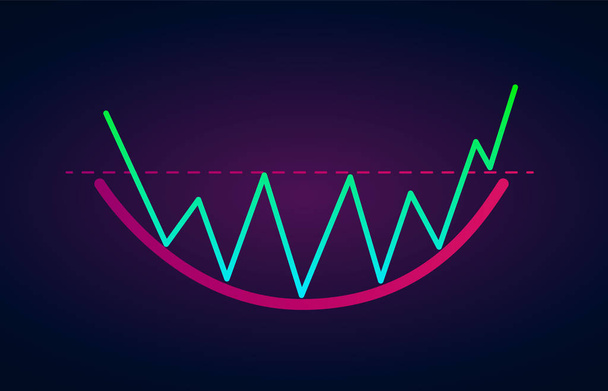
Rounding Bottom Pattern - bullish formation figure, chart technical analysis. Vector stock, cryptocurrency graph, forex analytics, trading market price breakouts icon
Sideways volatile trend definition flat vector icon isolated on white. Chart pattern figure technical analysis. Stock and cryptocurrency exchange graph, forex analytics, trading market price

Symmetrical Triangle Chart Patterns - formation price figure, technical analysis. Bullish or Bearish breakouts. Vector stock, cryptocurrency graph, forex analytics, trading market price breakouts icon

Bullish and Bearish Bat chart harmonic pattern formation - bullish or bearish technical analysis reversal or continuation trend figure. Vector stock, cryptocurrency graph, forex, trading market price

15 day of the war between Russia and Ukraine on a black background inscription in red color illustration for news.
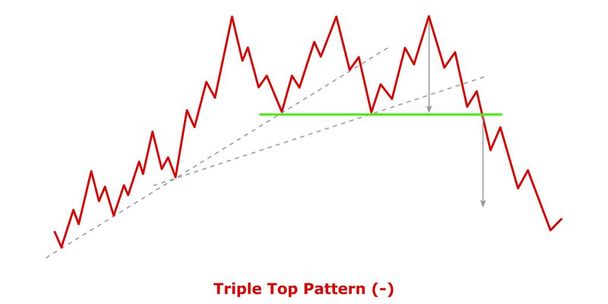
Triple Top Pattern (-) Green & Red

Diamond Top Pattern (-) Green & Red

Spike Reversal Pattern (-) White & Black

Falling Wedge Pattern (+) Green & Red

Descending Triangle Pattern (-) White & Black

Broadening Top Pattern (-) White & Black

Seamless pattern with striped black white straight lines and diagonal inclined lines (zigzag, chevron). Optical illusion effect, op art. Vector vibrant decorative background, texture.

Seamless pattern with circles and striped black white straight lines. Optical illusion effect. Geometric tile in op art style. Vector illusive background for cloth, textile, print, web.
Next button flat minimal icon, Vector illustration
Purse with credit cards and other icon in monochrome,flat style.gift sale of things, button more icons in set collection.

Business infographic 3D. Abstract background. Vector Illustration
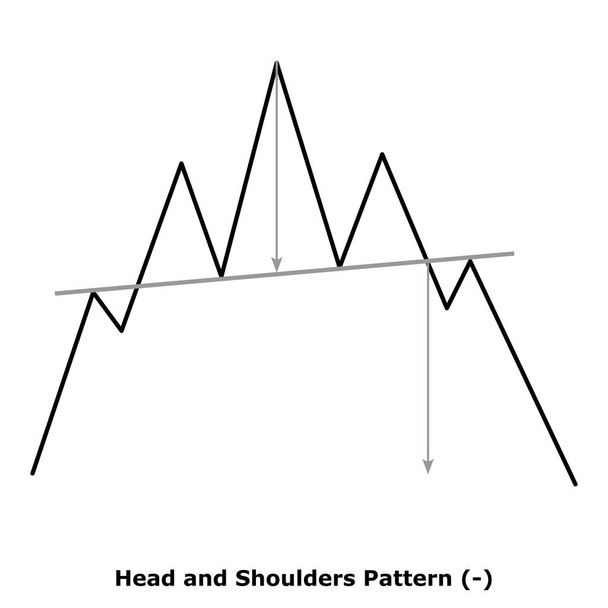
Head and Shoulders Pattern (-) White & Black

Double Top Pattern (-) White & Black

Pennant Pattern (-) White & Black
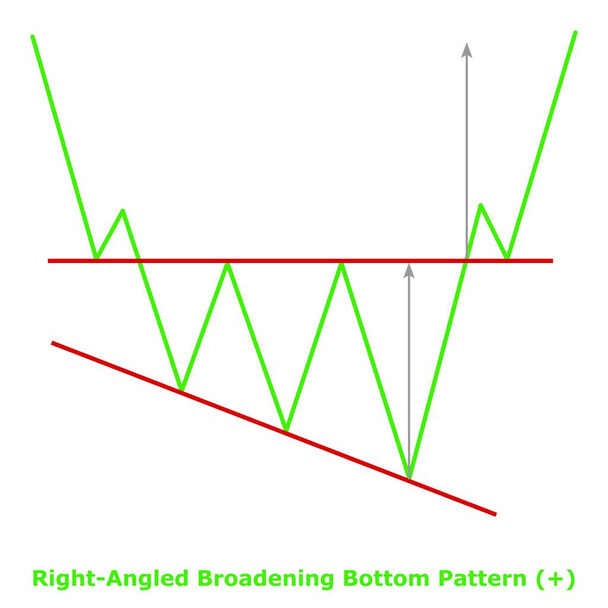
Right-Angled Broadening Bottom Pattern (+) Green & Red
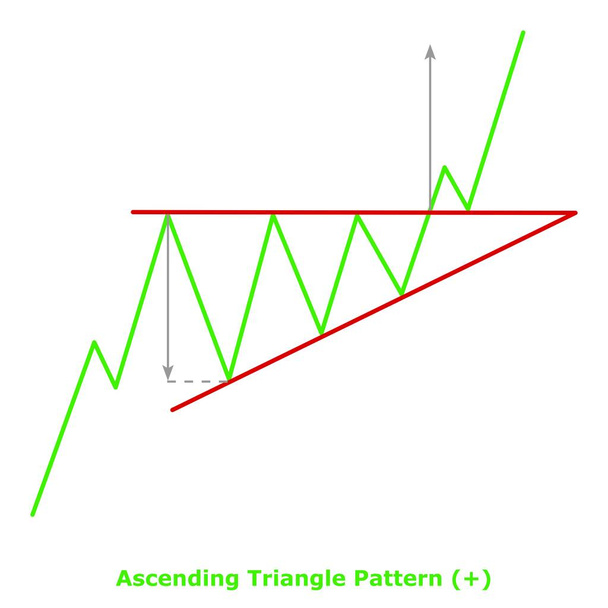
Ascending Triangle Pattern (+) Green & Red

Seamless pattern with striped black white straight lines and diagonal inclined lines (zigzag, chevron). Optical illusion effect, op art. Background for cloth, fabric, textile, tartan.

A man wearing tennis wear and playing tennis for health
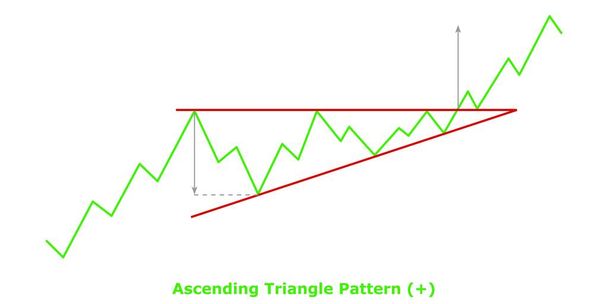
Ascending Triangle Pattern (+) Green & Red
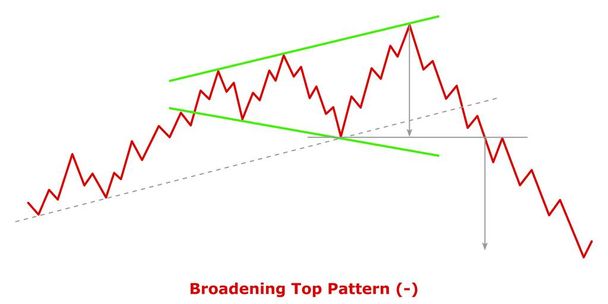
Broadening Top Pattern (-) Green & Red

New culture coronavirus SARS-CoV-2 VOC-202012-01. UK COVID-19 variant. Continuation of the epidemic.

Ideas baby boy newborn pictures birth announcements. Newborn poster baby boy african american, metrics children boy. Cartoon character isolated vector.
Bearish Gartley - Trading Harmonic Patterns in the currency markets. Bearish formation price figure, chart technical analysis. Stock, cryptocurrency graph, forex analytics, market price breakouts icon