


Filters
Stock videos of Statistics
Find the right royalty-free footage and animations with Statistics for commercial use.

Solid geometric objects for graphs. Rectangular bar chart Infographics loop animation. Charts and graphs. Business success concept. Data visualization elements.
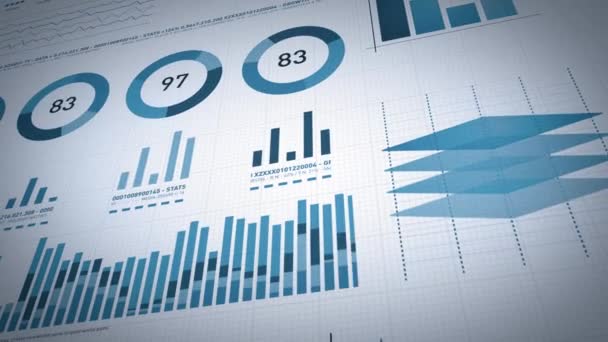
Business Statistics, Market Data And Infographics Layout/ 4k animation of a set of design business and market data analysis and reports, with infographics, bar stats, charts and diagrams

Bar graph with arrows axis. Grow, chart, statistic, business concept. Animation for yours presentation. Infographics in flat design.

Growing charts animation in addition to black BG -blue-
Yellow Pie chart infographic icon isolated on grey background. Diagram chart sign. 4K Video motion graphic animation.
Turquoise Pie chart infographic icon isolated on blue background. Diagram chart sign. 4K Video motion graphic animation.
Yellow Pie chart infographic icon isolated on grey background. Diagram chart sign. 4K Video motion graphic animation.

Business infographics with diagram loop animation. Charts and graphs. Business success and financial concepts. Presentation template. Data visualization elements.

Businesswoman Is Working With Mobile Phone And Stock Chart. Business Economic Concept
Business data graph chart drop down footage clip
Staff use mobile phones to view financial data charts
Turquoise Pie chart infographic icon isolated on blue background. Diagram chart sign. 4K Video motion graphic animation.

Conceptual business dashboard for financial data analysis . 3D render computer graphic .

Stock market statistics on financial graphs and charts, measuring exchange forex trading in real time on monitor. Global sales numbers with business hedge fund and profit trend. Close up.

Business Statistics, Market Data And Infographics Layout/ 4k animation of a set of design business and market data analysis and reports, with infographics, bar stats, charts and diagrams

Closeup hands of group business people meeting team for planning and strategy marketing at office, manager and employee discussing conference about finance of investment with graph and chart report.

Trader Woman Looking At Annual Sales Report On Mobile Phone. Slow Motion Effect

Solid geometric objects for graphs. Rectangular bar chart Infographics loop animation. Charts and graphs. Business success concept. Data visualization elements.

Screen with a stock market graphic. Cryptocurrency rate graphic showing data online. Japanese candlesticks and the volume of cryptocurrency turnover.

Double Exposure Image of Business and Finance conceptual - Businessman with report chart up forward to financial profit growth of stock market investment.

Top view of financial chart on office desk.
Blue Pie chart infographic icon isolated on orange background. Diagram chart sign. 4K Video motion graphic animation.

Employee works in the office analyzing business statistics

Tablet, documents and people hands in data analysis, charts and graphs of business growth, budget or finance. Financial planning, spreadsheet or statistics strategy of woman, team or partner in above.
Top view of a woman in a checkered shirt entering data in a laptop. Her colleagues are standing beside her and giving graphs with more information. Locked down shot, real time, medium shot

Business team meeting discussion. Professional investor working with new startup project. Finance managers task.Digital tablet laptop computer smarphone and finance charts.

Close up of hands of two businesspeople sitting at table and studying chart

Analytical finance motion background. Infographics background with numbers and charts showing global data statistics.

Close up of hands of two businesspeople sitting at desk and looking through chart. Businesswoman making notes in notebook

Head in suit writes the interest income on a white board with a schedule

Office teamwork - business people discussing financial reports
Blue Pie chart infographic icon isolated on orange background. Diagram chart sign. 4K Video motion graphic animation.
Statistics icon design, Video Animation

Business Partners Working Together in the office

Woman Looking At Graph And Charts On Mobile Phone

Business charts with financial indicators on white board in office. Business statistics and analytics concept

Teamwork over statistics with graphs. Business meeting

Businessman Checks Financial Report And Analyzes Stock Exchange Statistics

A girl holds a phone with An Online Stock Market Chart Showing The Bearish And Bullish Trends Of Bitcoin Currency.

Close up businessman shows points pen to infographics diagram in hand presentation investors strategy business plan achieving targets company remote online video conference call webcam chat laptop

Screen with a stock market data. History of Bitcoin cryptocurrency rate and support lines. Drawing a new support line.

Double Exposure Image of Business and Finance conceptual - Businessman with report chart up forward to financial profit growth of stock market investment.

Business Statistics, Market Data And Infographics Layout Pack/ 4k animation of a set of design business and market data analysis and reports, with infographics, bar stats, charts and diagrams

Analyzing colorful financial report

Business infographics with diagram loop animation. Charts and graphs. Business success and financial concepts. Presentation template. Data visualization elements.

Solid geometric objects for graphs. Rectangular bar chart Infographics loop animation. Charts and graphs. Business success concept. Data visualization elements.

Business people discussing graph and chart reports at office

Solid geometric objects for graphs. Rectangular bar chart Infographics loop animation. Charts and graphs. Business success concept. Data visualization elements.

Business Statistics, Market Data And Infographics Layout/ 4k animation of a set of design business and market data analysis and reports, with infographics, bar stats, charts and diagrams

Abstract Close-Up Financial Analyzing Concept Stock Market

Happy young Asia businessmen and businesswomen meeting brainstorming ideas about new paperwork project colleagues working together planning success strategy enjoy teamwork in small modern office.

Solid geometric objects for graphs. Rectangular bar chart Infographics loop animation. Charts and graphs. Business success concept. Data visualization elements.

Solid geometric objects for graphs. Rectangular bar chart Infographics loop animation. Charts and graphs. Business success concept. Data visualization elements.

Business woman illustrates the financial data to her customer

Boss of bankrupt company shouting at conference, failed business, deadline

Close-up asia business people meeting plan analysis statistics brainstorm and header of team hold tablet pointing graph chart and employee take note. Finance strategy statistics success concept.

Accountant Man Checks Financial Report And Analyzes Stock Exchange Statistics

Business Statistics, Market Data And Infographics Layout Pack/ 4k animation of a set of design business and market data analysis and reports, with infographics, bar stats, charts and diagrams
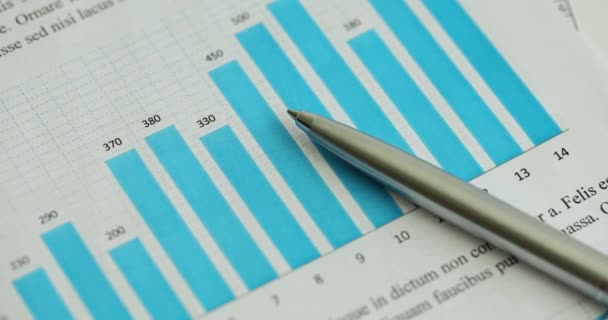
Pen on financial report of analytical sales figures. Concept of data analysis and investment planning and business statistics
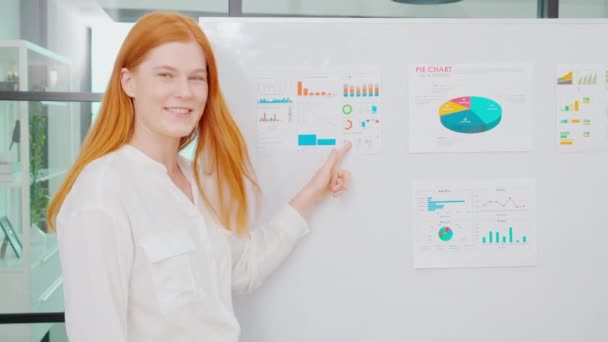
Portrait young caucasian businesswoman presentation marketing and profit with confident at office, investment and seminar for planning of finance, business woman standing explaining chart and graph.

Business man analyzing financial statistics displayed on tablet screen. Analytics statistics and financial indicators in charts

Closeup of financial report analytics statistics documents on white board. Annual report or presentation with statistical data in form of charts

Close up of hands of three business colleagues standing at whiteboard with charts and discussing them. One businesswoman holding smartphone and the other holding notebook and pen

Business consultant marketer attaches statistical report to white board in office. Preparation for analytical conference and training

Businessmen discussing business charts and diagrams

Millennial Asia businessmen and businesswomen meeting brainstorming ideas about new paperwork project colleagues working together planning success strategy enjoy teamwork in small modern night office.

Tablet with business charts and persons draws a question mark. Study of statistics analytics and business marketing

Businesswomen discussing on financial data using a tablet computer

Businessman analyzing business financial reports in office

A fluctuating bar graph and a flowing line graph. Concepts about the graph of variation and prediction.

Statistical graph with business finance concept, 3d rendering.
Blue Pie chart infographic icon isolated on orange background. Diagram chart sign. 4K Video motion graphic animation.

Man working with a tablet on the table with a scattered chart

Man hand writes the interest income on a white board with a schedule

Two men in suits discussing company statistics, showing graph document, business

Business people developing a business project and analyzing market data information on a modern digital tablet computer

Business woman pins analytics report and investment charts. Statistical concepts and financial charts

Solid geometric objects for graphs. Rectangular bar chart Infographics loop animation. Charts and graphs. Business success concept. Data visualization elements.

Woman manager explaining to trainee principles of working in business on charts on board 4k movie slow motion. Business development school concept

Accountant Checks Financial Report And Analyzes Stock Exchange Statistics

Analyst draws question mark on tablet with financial charts. Answers and questions on business statistics of sales and services

Double Exposure Image of Business and Finance conceptual - Businessman with report chart up forward to financial profit growth of stock market investment.

Business woman works in the office with the financial graphs and charts

Business Statistics, Market Data And Infographics Layout/ 4k animation of a set of design business and market data analysis and reports, with infographics, bar stats, charts and diagrams

Business people developing a business project and analyzing market data information on a modern digital tablet computer

Conceptual business dashboard for financial data analysis . 3D render computer graphic .
Turquoise Pie chart infographic icon isolated on blue background. Diagram chart sign. 4K Video motion graphic animation.

Graphs, documents and people hands for data analysis, charts and planning business growth, creative report and strategy. Brainstorming, infographics and teamwork for woman and partner with statistics.

Businesswoman Work In Office, Using Smartphone With Business Report On Screen

Business infographics with diagram loop animation. Charts and graphs. Business success and financial concepts. Presentation template. Data visualization elements.

Conceptual business dashboard for financial data analysis . 3D render computer graphic .

Bar graph with arrows axis. Grow, chart, statistic, business concept. Animation for yours presentation. Infographics in flat design.

Business stock traders people in meeting room working on crypto currency markets with blockchain technology - Decentralized finance and stock exchange concept

Businessman working in the office with the charts
Turquoise Data analysis icon isolated on blue background. 4K Video motion graphic animation.

Business Statistics, Market Data And Infographics Layout Pack/ 4k animation of a set of design business and market data analysis and reports, with infographics, bar stats, charts and diagrams