


Filters

Stock vector images of Pourcentage
Discover royalty-free, professionally-designed vector art of Pourcentage for personal and commercial use.

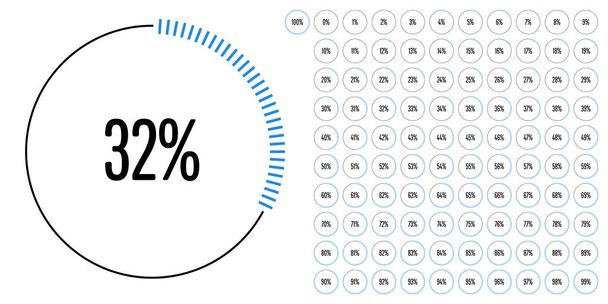
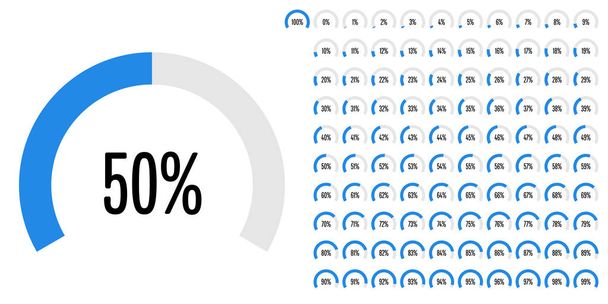
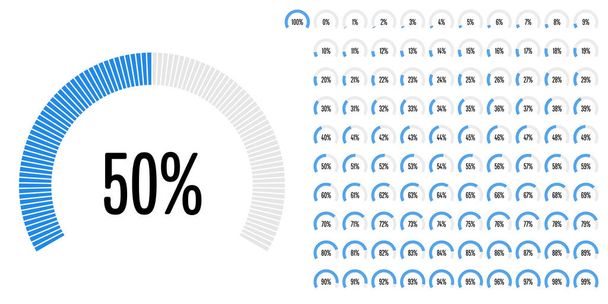
Set of circular sector percentage diagrams from 0 to 100 ready-to-use for web design, user interface (UI) or infographic - indicator with blue

Set of semicircle percentage diagrams from 0 to 100 ready-to-use for web design, user interface (UI) or infographic - indicator with yellow

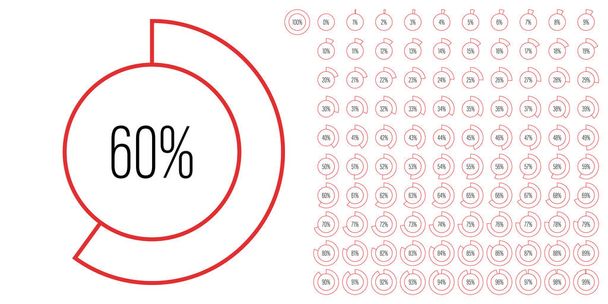
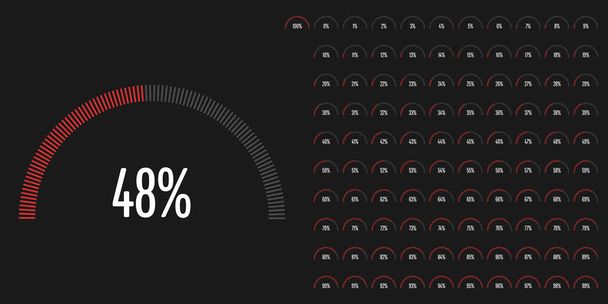
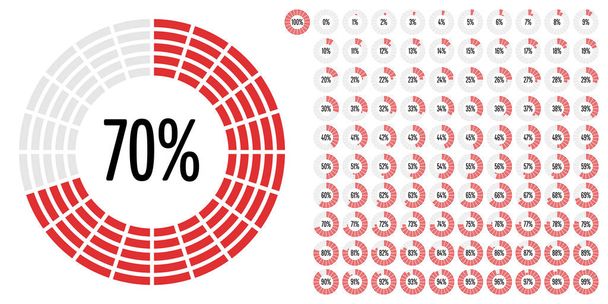
Set of circular sector percentage diagrams from 0 to 100 ready-to-use for web design, user interface (UI) or infographic - indicator with red

Set of circle percentage diagrams meters from 0 to 100 ready-to-use for web design, user interface UI or infographic - indicator with yellow

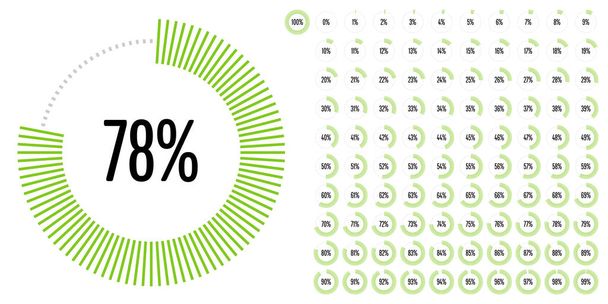
Set of circular sector percentage diagrams from 0 to 100 ready-to-use for web design, user interface (UI) or infographic - indicator with green
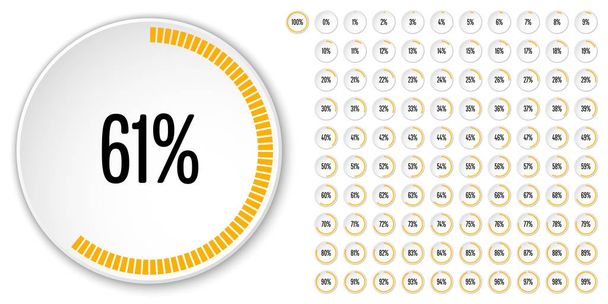
Set of circle percentage diagrams from 0 to 100 ready-to-use for web design, user interface (UI) or infographic - indicator with yellow


Set of circle percentage diagrams from 0 to 100 ready-to-use for web design, user interface (UI) or infographic - indicator with blue

Set of circle percentage diagrams from 0 to 100 ready-to-use for web design, user interface (UI) or infographic - indicator with yellow

Set of circle percentage diagrams from 0 to 100 for web design, user interface (UI) or infographic - indicator with green
Set of circle percentage diagrams meters from 0 to 100 ready-to-use for web design, user interface UI or infographic - indicator with red
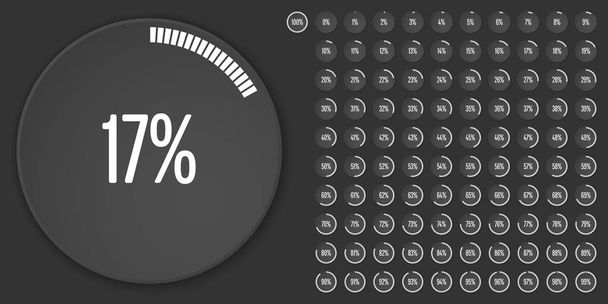
Set of circle percentage diagrams from 0 to 100 ready-to-use for web design, user interface (UI) or infographic - indicator with white
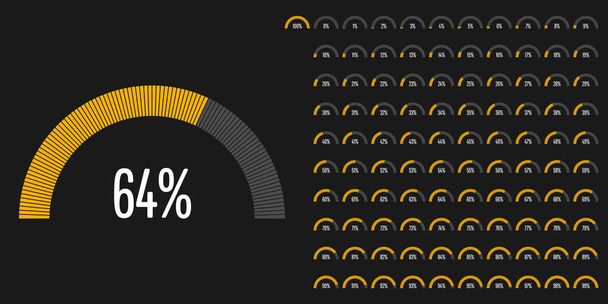
Set of semicircle percentage diagrams from 0 to 100 ready-to-use for web design, user interface (UI) or infographic - indicator with yellow

Set of circle percentage diagrams from 0 to 100 for infographics
Set of circle percentage diagrams from 0 to 100 ready-to-use for web design, user interface (UI) or infographic - indicator with blue

Set of circle percentage diagrams meters from 0 to 100 ready-to-use for web design, user interface UI or infographic - indicator with blue

Set of circle percentage diagrams from 0 to 100 ready-to-use for web design, user interface (UI) or infographic - indicator with yellow
Set of circle percentage diagrams from 0 to 100 ready-to-use for web design, user interface (UI) or infographic - indicator with green
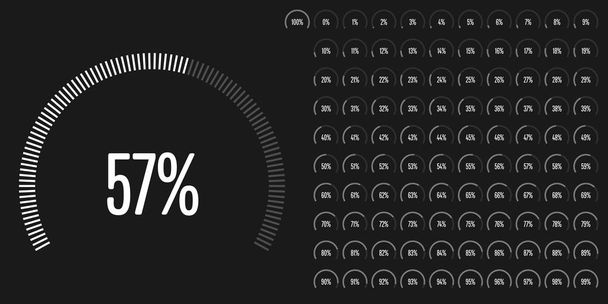
Set of circular sector percentage diagrams from 0 to 100 ready-to-use for web design, user interface (UI) or infographic - indicator with white

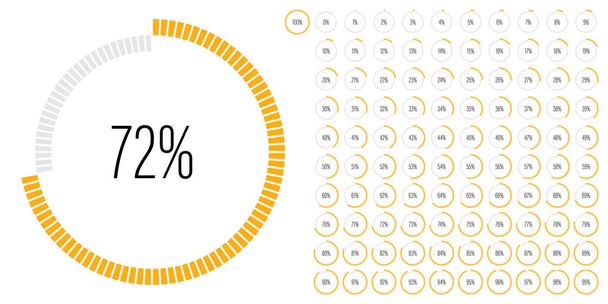
Set of rectangle percentage diagrams meters from 0 to 100 ready-to-use for web design, user interface UI or infographic - indicator with yellow

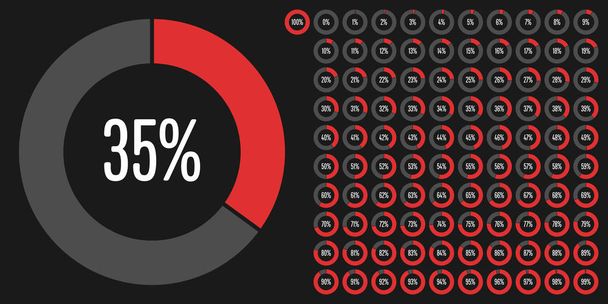
Set of circle percentage diagrams from 0 to 100 ready-to-use for web design, user interface (UI) or infographic - indicator with red

Set of circle percentage diagrams (meters) from 0 to 100 ready-to-use for web design, user interface (UI) or infographic - indicator with red

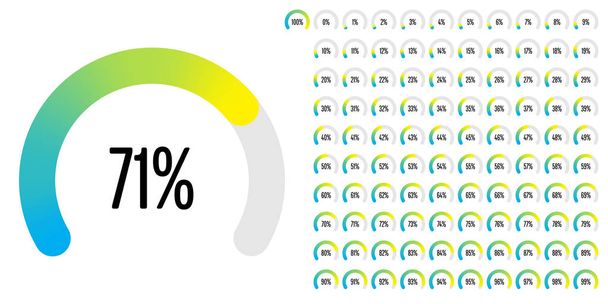
Set of circular sector percentage diagrams from 0 to 100 ready-to-use for web design, user interface (UI) or infographic - indicator with gradient from cyan (blue) to yellow

Set of circle percentage diagrams from 0 to 100 for web design, user interface (UI) or infographic - indicator with pink
Set of circle percentage diagrams from 0 to 100 for web design, user interface (UI) or infographic - indicator with blue

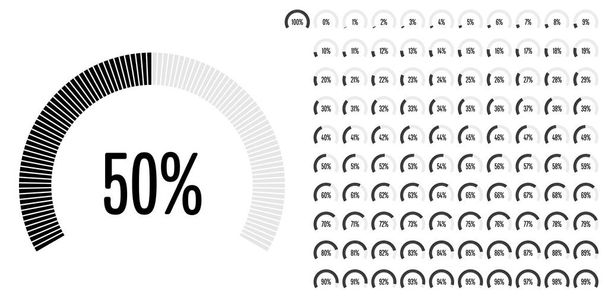
Set of circular sector percentage diagrams from 0 to 100 for web design, user interface (UI) or infographic - indicator with black
Set of semicircle percentage diagrams from 0 to 100 ready-to-use for web design, user interface (UI) or infographic - indicator with red


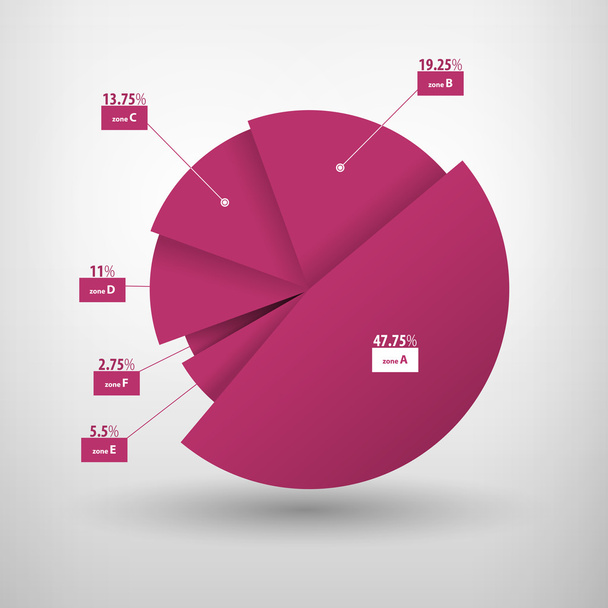
Set of circular sector percentage diagrams from 0 to 100 ready-to-use for web design, user interface (UI) or infographic - indicator with pink
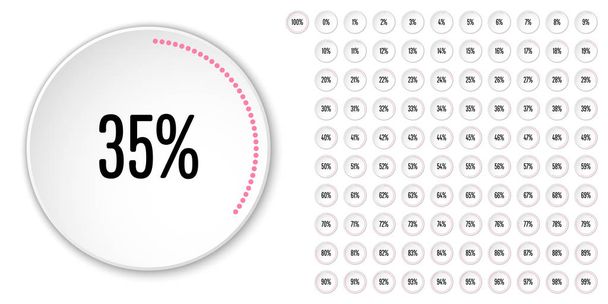
Set of circle percentage diagrams from 0 to 100 ready-to-use for web design, user interface (UI) or infographic - indicator with pink
Set of circular sector percentage diagrams from 0 to 100 ready-to-use for web design, user interface (UI) or infographic - indicator with pink

Set of circle percentage diagrams from 0 to 100 ready-to-use for web design, user interface (UI) or infographic - indicator with red
Set of circle percentage diagrams from 0 to 100 ready-to-use for web design, user interface (UI) or infographic - indicator with red

Set of circular sector percentage diagrams from 0 to 100 ready-to-use for web design, user interface (UI) or infographic - indicator with green


Set of circle percentage diagrams from 0 to 100 ready-to-use for web design, user interface (UI) or infographic - indicator with gradient from cyan (blue) to yellow

Set of circle percentage diagrams from 0 to 100 for web design, user interface (UI) or infographic - indicator with red

Set of circle percentage diagrams from 0 to 100 ready-to-use for web design, user interface (UI) or infographic - indicator with yellow
Set of circular sector percentage diagrams from 0 to 100 for web design, user interface (UI) or infographic - indicator with

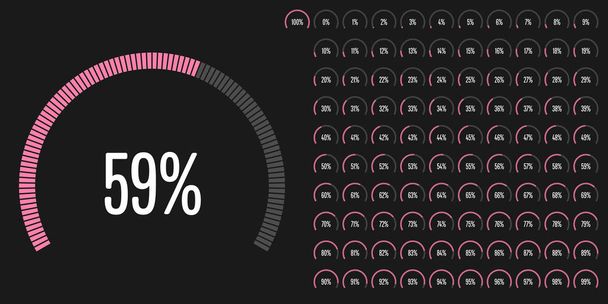
Set of circular sector arc percentage diagrams meters progress bar from 0 to 100 ready-to-use for web design, user interface UI or infographic - indicator with pink
Set of circle percentage diagrams from 0 to 100 ready-to-use for web design, user interface (UI) or infographic - indicator with red

Set of circle percentage diagrams from 0 to 100 ready-to-use for web design, user interface (UI) or infographic - indicator with pink

Set of circle percentage diagrams (meters) from 0 to 100 ready-to-use for web design, user interface (UI) or infographic - indicator with white
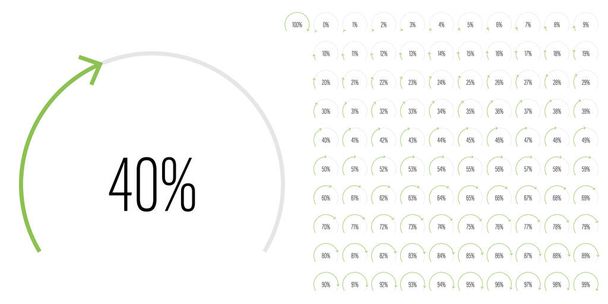
Set of circular sector percentage diagrams meters from 0 to 100 ready-to-use for web design, user interface UI or infographic - indicator with green

Set of circle percentage diagrams from 0 to 100 ready-to-use for web design, user interface (UI) or infographic - indicator with green
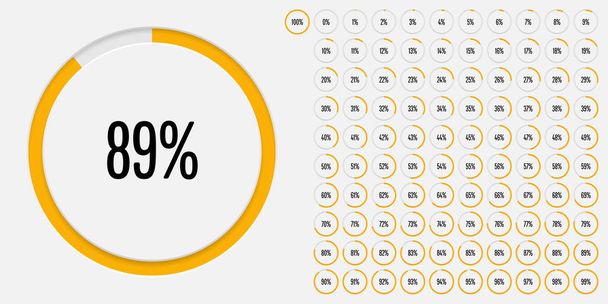
Set of circle percentage diagrams meters from 0 to 100 ready-to-use for web design, user interface UI or infographic - indicator with yellow
Set of circle percentage diagrams meters from 0 to 100 ready-to-use for web design, user interface UI or infographic - indicator with yellow

Set of circle percentage diagrams from 0 to 100 ready-to-use for web design, user interface (UI) or infographic - indicator with green

Set of circular sector percentage diagrams from 0 to 100 ready-to-use for web design, user interface (UI) or infographic - indicator with white

Set of circle percentage diagrams from 0 to 100 ready-to-use for web design, user interface (UI) or infographic - indicator with green

Set of circular sector percentage diagrams from 0 to 100 for web design, user interface (UI) or infographic - indicator with

Set of circle percentage diagrams meters from 0 to 100 ready-to-use for web design, user interface UI or infographic - indicator with red

Set of circular sector percentage diagrams from 0 to 100 ready-to-use for web design, user interface (UI) or infographic - indicator with pink