


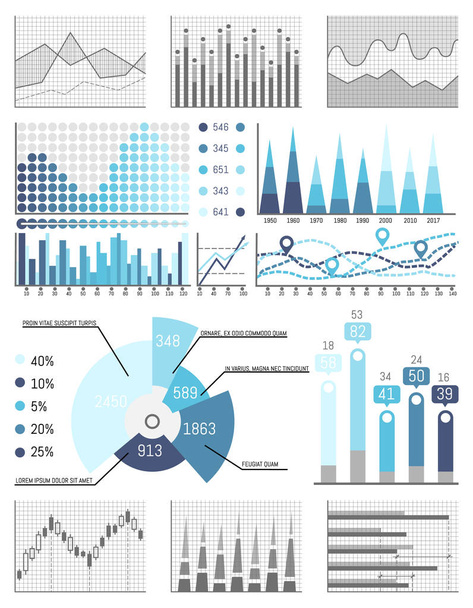
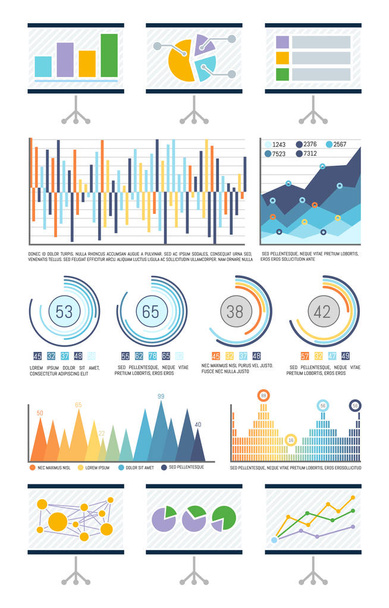
Infographic chart vector template. Annual statistics curve graph design. Market data diagrams. Graphic information visualization and analysis. Statistical indicators and frequency of data changes - Vector Image
By robuart 4402x5001 px
Stock Vector ID: 614523254
Free for use in the editor and download.

Free for personal and commercial purposes with attribution.
Attribution after download is required.

Similar Royalty-Free Vectors


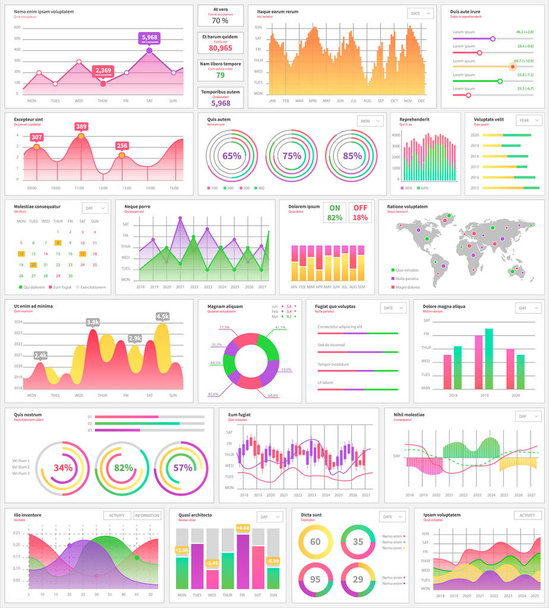
Infographic UI. Dashboard mockup with statistics and analytics. Web interface design with collection of charts graphs and diagrams. Financial information, modern business presentation, vector set


More from
robuart
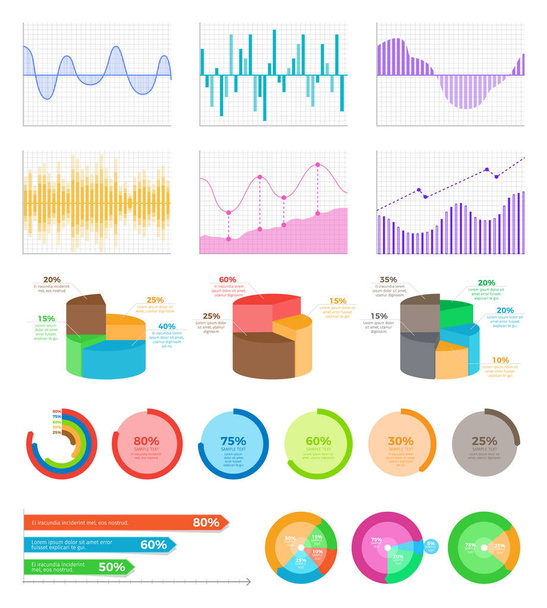
Infographics and infocharts visualization information vector. Scheme and diagrams set, map of world with colorful different parts analysis statistics, graphic flat style

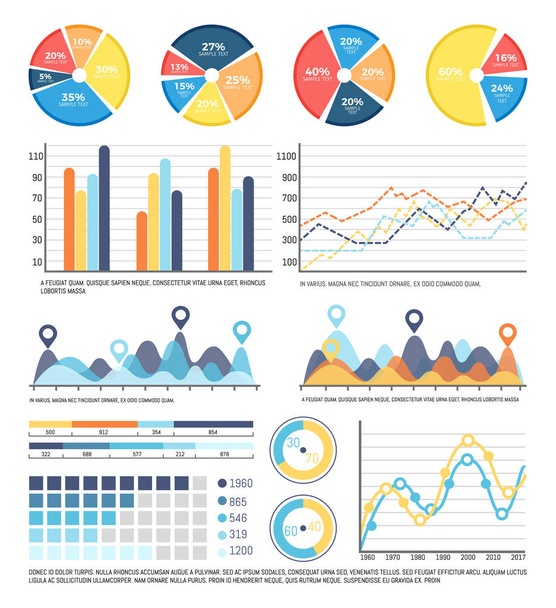
Infographics report on data received in research vector. Business information organized in flowcharts and infographs. Presentation of pie diagrams

Pie diagram with sectors, percentage information vector. Statistics and analysis, organization, of data in flowcharts schemes. Explanation text sample

Statistics in visual form, charts and flowcharts vector. Presentation whiteboard with schemes, analyzed data infographics. Pie diagram with segments

Infographics with numbers and figures isolated icons vector. Graphics and schemes of information, business strategy and planning. Plans on flowcharts