


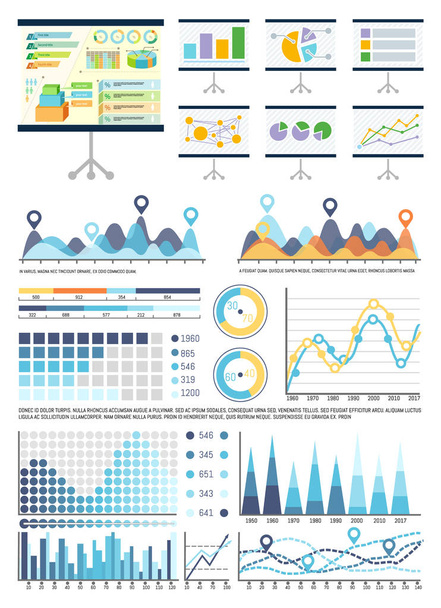
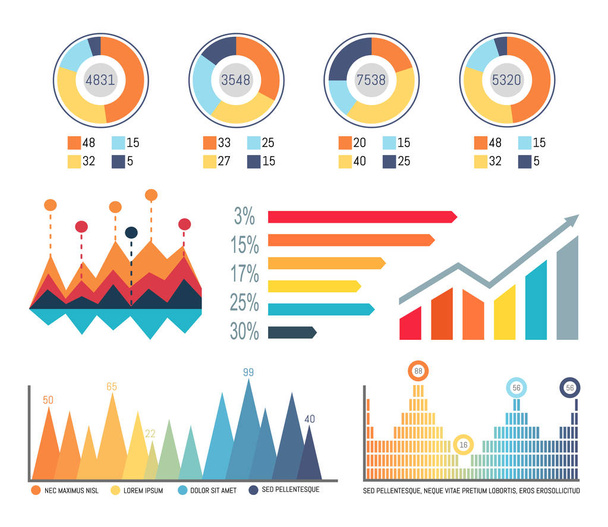
Infographics and schemes on whiteboard presentation stand vector. Graphics visualization of information, business figures and statistics analysis - Vector Image
By robuart 4381x5001 px
Stock Vector ID: 239271550
Free for use in the editor and download.

Free for personal and commercial purposes with attribution.
Attribution after download is required.

Similar Royalty-Free Vectors
Whiteboard with infocharts and infographics data vector. Graphic representation of information, business conceptualisation. Flowcharts and pie diagram

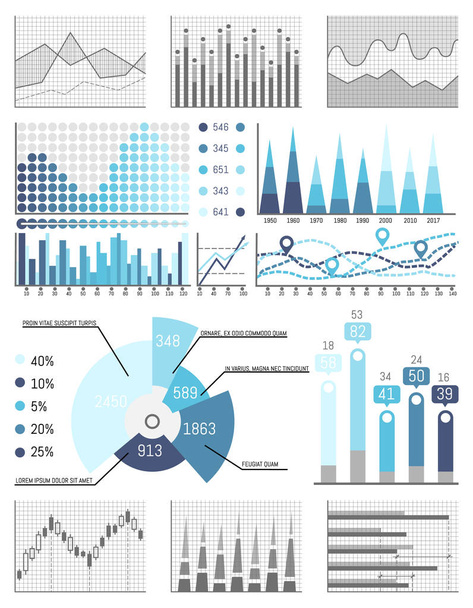
Pie diagram with sectors, percentage information vector. Statistics and analysis, organization, of data in flowcharts schemes. Explanation text sample


Infographics with numbers and figures isolated icons vector. Graphics and schemes of information, business strategy and planning. Plans on flowcharts


Infographic with timeline and numbers information vector. Schemes with percentage on pie diagram, charts with pointer and location signs, flowcharts

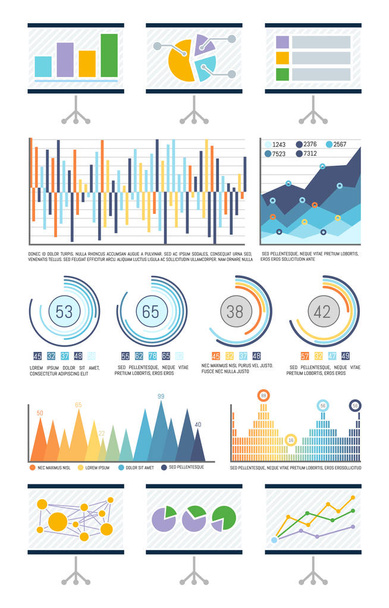
Statistics in visual form, charts and flowcharts vector. Presentation whiteboard with schemes, analyzed data infographics. Pie diagram with segments
More from
robuart


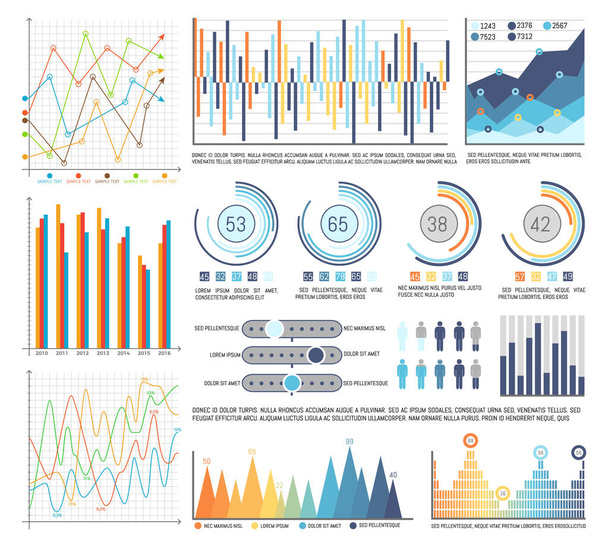
Infochart with data, flowchart visual information representation vector. Diagrams and schemes, charts with falling and growing lines design results
Infographics and diagrams, flowcharts information vector. Schemes of increasing results, conceptualization of received data. Numerical data statistics


Infographics, analyzed data by office workers pointing to presentation vector. Visual information, pie diagrams and schemes with numeric info data

Infographics and charts with lines graphics vector. Dots and curves, visualization and conceptualization of data. Schemes and numeric figures results
