


Money laying on the table of an exchange rate of currency.
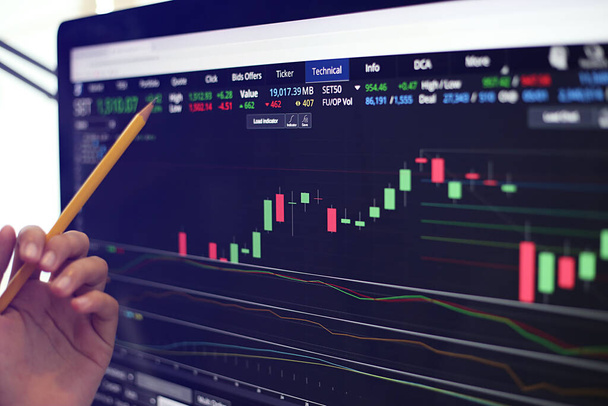
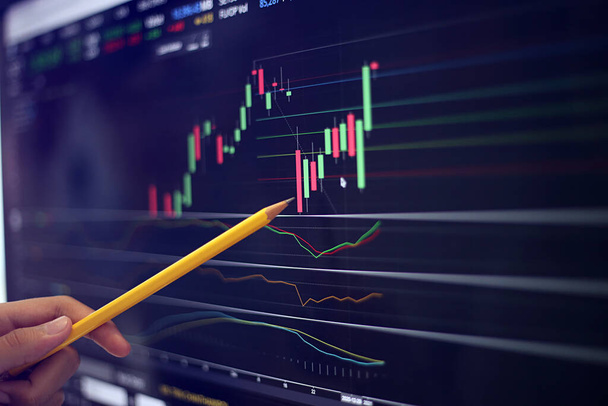
After news of covid 19 vaccine production came out, the Thai stock market had rallied more than 38 points yesterday, while today, 6 January 2021, the stock market fell slightly in the morning.
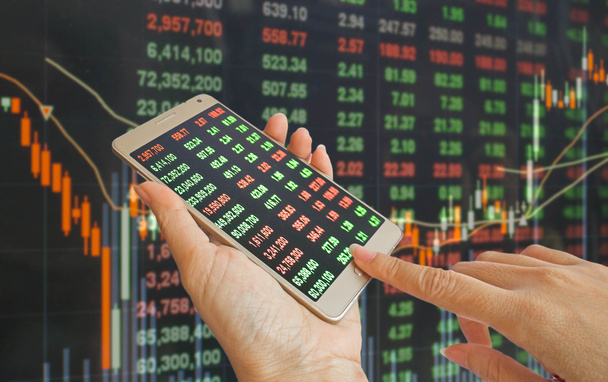
Hand using mobile phone with background of stock market price

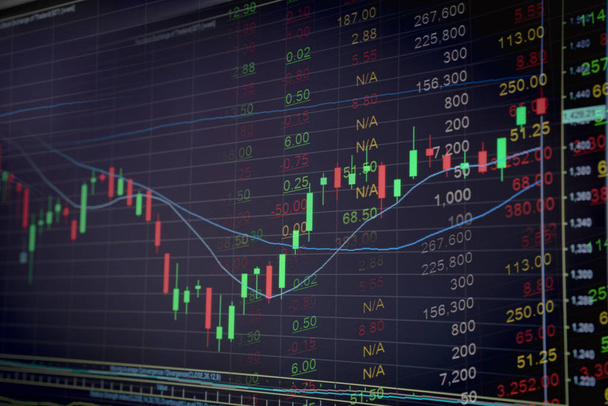
Stock market chart

Business financial chart with pen

Stock market graphs and numbers list

Concept Business and financial. Pen and charts of chart trade report.

Financial accounting

A city business man pointing on laptop screen device to check stocks and market data. selective focus.

Stock market data and cubes chart

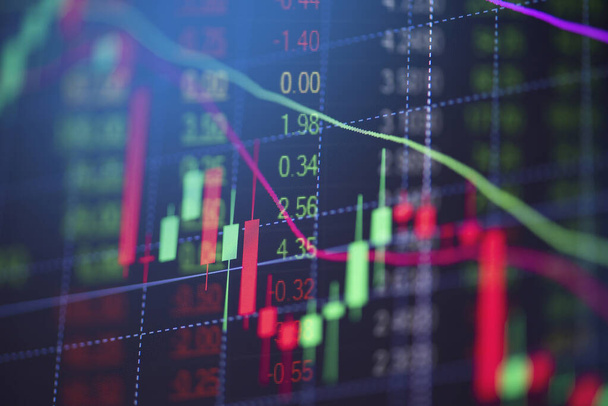
Index graph of stock market financial indicator analysis on LED. Abstract stock market data trade concept. Stock market financial data trade graph background. Global financial graph analysis concept.

Management strategy analysis accounting. Financial business technology hologram concept.

Finger touch on screen with stock market data

Savings account bank book showing money about and coins on the book. Business graphic chart showing decline economic

Business man use computer keyboard press show to Data analyzing Business candle stick chart of Display stock market investment trading on screen

Stock exchange market trading graph over the screen of computer laptop on wood table over the photo blurred of trading graph background, business marketing trade concept

Showing business and financial report.

Pen on a colourful diagram. Closeup

Business candle stick graph chart of stock market investment trading on background design / Trend of stock graph market exchange financial economy concept

Financial stock market data. Candle stick graph chart of stock market ,stock market data graph chart on LED concept

Close-up finger pointing on stock exchange chart

Accounting and financial analysis

Financial graphics loupe and pencils
Stock market board background price graph chart.
Stock market graph trading analysis investment financial, stock exchange financial or forex graph stock chart graph business crisis crash loss and grow up gain and profits win up trend growth money

Stock market graph with pen

Hourglass standing on table with sand trickling, man working with graphs, data, stock footage. High quality photo

Showing business and financial report.

Economic graph with diagrams on the stock market, for business and financial concepts and reports.Abstract blue background.

Stock analysis with digital tablet and hand pointing

Close up Green and red Candle graph on digital screen. Concept for financial and stock graph.

Stock market indicator and financial data view from LED. Double exposure financial graph and stock indicator including stock education or marketing analysis. Abstract financial indicator background.

Finance stock board with graph market volatility

Index graph of stock market financial indicator analysis on LED. Abstract stock market data trade concept. Stock market financial data trade graph background. Global financial graph analysis concept.

Stock Market Broker in formalwear Analyzing Graphs on screens in the office, investment concept

Financial charts, market analysis

Stock market or forex trading graph and candlestick chart suitable for financial investment concept. Economy trends background for business idea and all art work design. Abstract finance background.

Stock market graph

3d rendering growth graph on digital tablet
After news of covid 19 vaccine production came out, the Thai stock market had rallied more than 38 points yesterday, while today, 6 January 2021, the stock market fell slightly in the morning.

Analysis for professional technical analysis on the monitor of a computer. Fundamental and technical analysis concept.

Financial and business color charts and graphs on the table

Stock market chart, Stock market data on LED display concept

Showing business and financial report. Business chart showing financial success at the stock market, business and finance concept. calculators on financial statements.

Stock market graph with pen

"forex trading graph and candlestick chart suitable for financial investment concept. Economy trends background for business idea and all art work design. Abstract finance background."

Stock market Charts . Two Hundred rolled us dollar bills staying on the graph. Two more hundred us dollar bills on the foreground. Macro image. Red and black lines on the chart. . High quality photo

Hand business man check stock chart on working desk with laptop and stock chart graphic on palm , Business and Technology concept

Digital tablet display the stock market data