


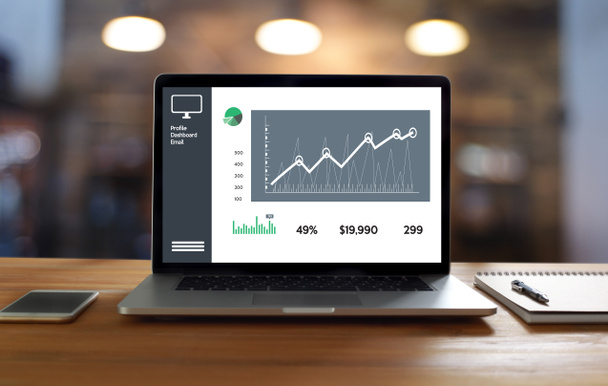
Business Man Sales Increase Revenue Shares and Customer Marketing Sales Dashboard Graphics Concept
Business Man Sales Increase Revenue Shares and Customer Marketing Sales Dashboard Graphics Concept
Business man work chart schedule or planning financial report data methodology

Business data dashboard provide modish business intelligence analytic for marketing strategy planning

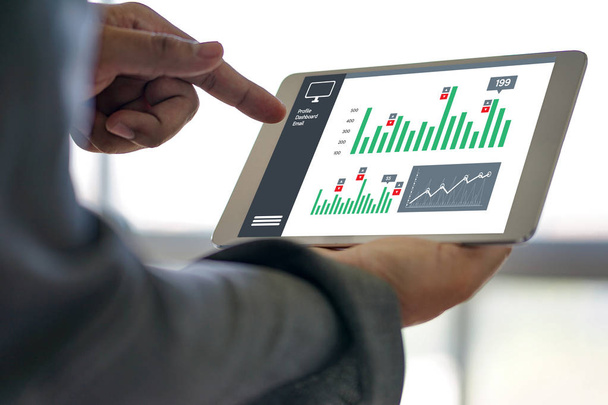
Businesswoman showing graphs by finger at the digital tablet

Business man working and analyzing financial figures on a graphs on a laptop in the office

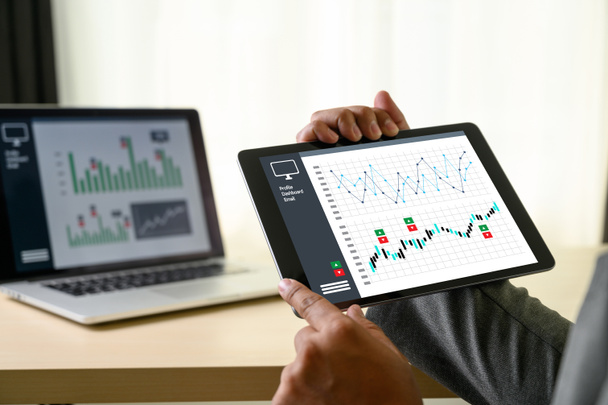
Tablet screen displaying a financial analysis concept

Business development and technology Data analyst. business analytics dashboard Business Intelligence BI data visualization, metrics and KPI key performance indicators and reports management.

Business man working and analyzing financial figures on a graphs using tablet

Business plan graph growth and increase of chart positive indicators in his business,tablet in hand

Business plan graph growth and increase of chart positive indicators in his business,tablet in hand

Tablet computer and financial chart

Business plan graph growth and increase of chart positive indicators in his business,tablet in hand


Investor data and information analysis chart for planning in strategy of stock market money or fund. Invest for earning or profit. Investment in business and financial concept of growth and success

Working Data Analytics and Data Management Systems and Metrics connected to corporate strategy database for Finance, Intelligence, Business Analytics with Key Performance Indicators, social network

Business plan graph growth and increase of chart positive indicators in his business,tablet in hand

Data analysis Data Management System with KPI and metrics connected to the database investment finance, operations, sales, marketing, businessman using smartphone working with dashboard data charts

Business data dashboard provide modish business intelligence analytic for marketing strategy planning

Business Man Sales Increase Revenue Shares and Customer Marketing Sales Dashboard Graphics Concept

Business plan graph growth and increase of chart positive indicators in his business,tablet in hand
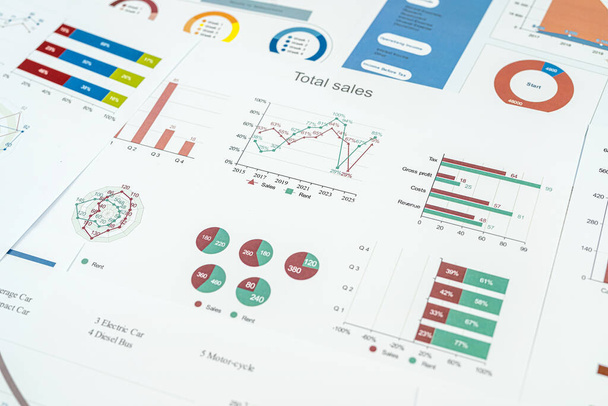
Pile of chart graph paper. Financial account statistics concept. Paperwork

Man use notebook at screen financial investment data graph, chart business growth increase at home. Business and technology, analyzing financial chart.

Businessman hand working with laptop on wooden desk in office. can be used on an ad

Business person delve into data analytics to uncover trends and insights from predictive big data models to real-time analysis, learn how data driven decisions propel analytic industries forward Faas

Businessman using a laptop with Analytics and Data Management Systems Analyst working in Business Analytics and Data Management Systems to make reports and corporate strategy for finance, operations

Image of workplace with electronic document in touchpad

Businessmen use technology to manage data analysis dashboard report accounting financial and system information strategy growth platform business concept.

Close-up of workplace mess filled with business papers, tablet with diagrams and charts on device screen. Business, strategy, statistics, report concept

Dashboard insight Data Management System Analysis Key Performance Indicators.Business report marketing, financial organization strategy.

Businessman's hand using tablet computer to work with financial

Close up of overworked black manager checking graph documents on tablet pc. Busy african employee analysing financial statistics in workplace overworking writing, searching.

Businessperson working with project management. Analyst planning with data and information, corporate business plan, marketing competitive research , financial and budget analysis in sales