


Filters

Stock royalty-free photos and images of Показатели
Discover unlimited high resolution images of Показатели and stock visuals for commercial use.

Key Performance Indicator (KPI) workinng with Business Intelligence (BI) metrics to measure achievement and planned target.businessman using digital tablet and laptop computer and document in modern office

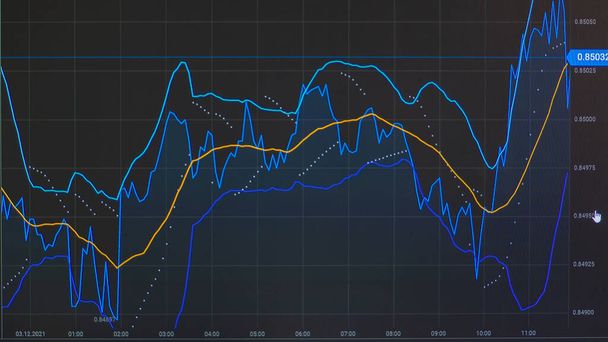
Diagrams charts illustrate statistics concept

Key Performance Indicator (KPI) workinng with Business Intelligence (BI) metrics to measure achievement and planned target.co working team meeting concept,businessman using smart phone and digital tablet and laptop computer.

Key Performance Indicator (KPI) workinng with Business Intelligence (BI) metrics to measure achievement and planned target.Man using VOIP headset with digital tablet computer as concept communication or it support or call center and customer service.

Business man pointing the text: Risk Management

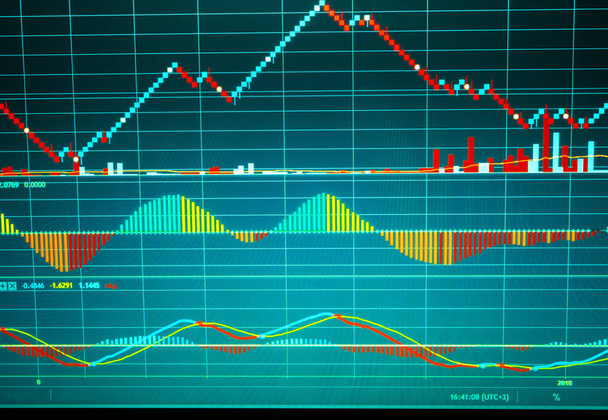
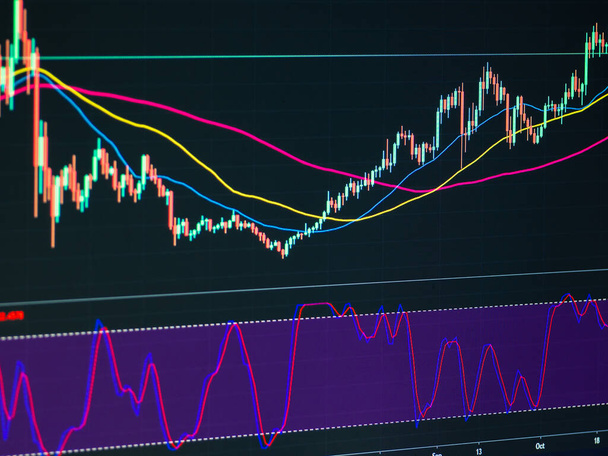
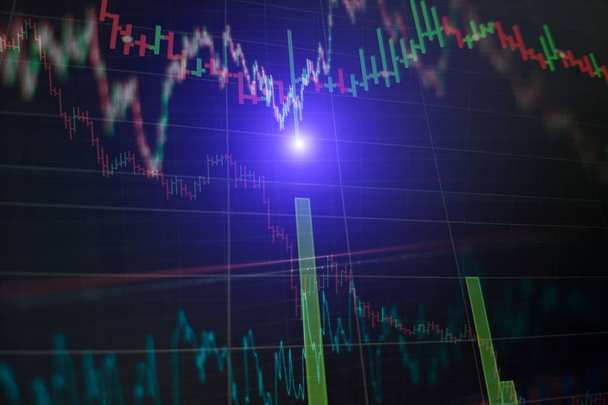
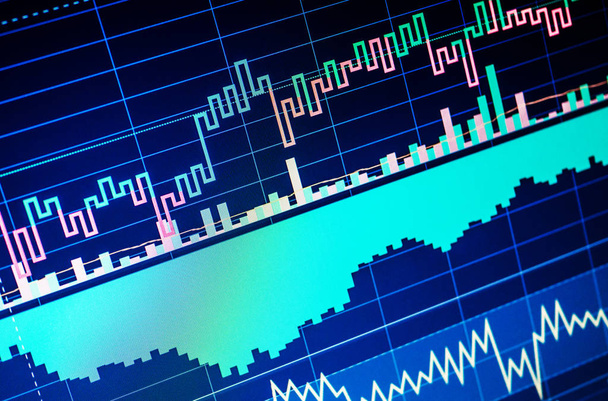
Charts of financial instruments with various type of indicators including volume analysis for professional technical analysis on the monitor of a computer. Fundamental and technical analysis concept
8. Stock market chart on computer display. Business analysis diagram. Fundamental and technical analysis concept

Charts of financial instruments with various type of indicators including volume analysis for professional technical analysis on the monitor of a computer. Fundamental and technical analysis concept

Binary option chart with put and call 3D elements arrows. Green and red color arrows on brown color chart background with volume indicators. 3D illustration on textured background.

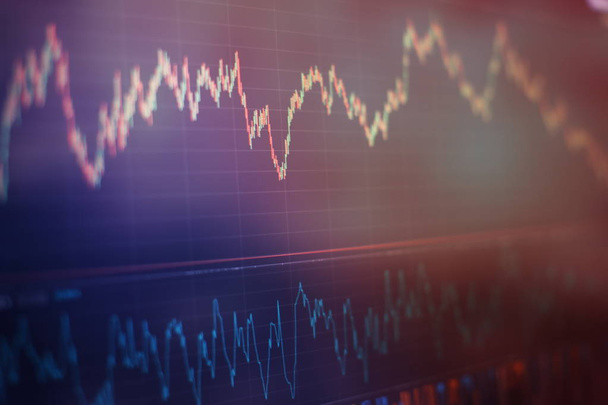
Stock market and other finance themes. Financial data on a monitor. Finance data concept

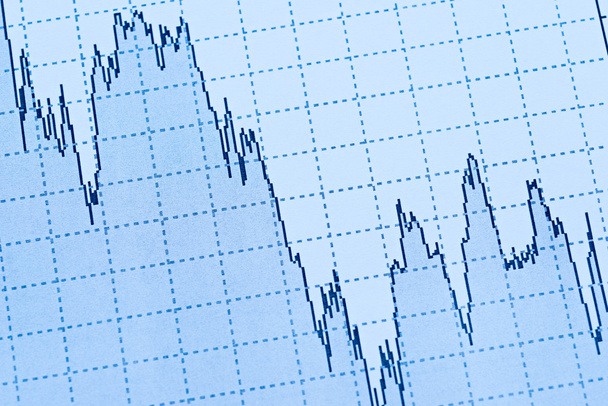
Red and blue candlestick chart. Economy trends background for business idea
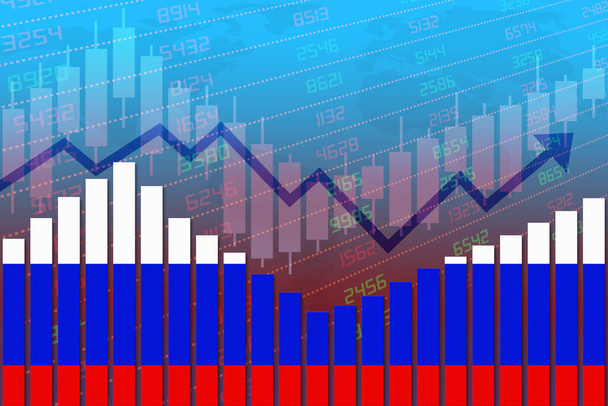
Flag of Russia on bar chart concept of economic recovery and business improving after crisis such as Covid-19 or other catastrophe as economy and businesses reopen again.

Stock graph chart candle stick with fibonacci line in bearlish market and cityscape on background, stock price down in bearlish market concept

Financial app shows bar chart of financial instrument with growing prices, with averages, volume and important economic data.

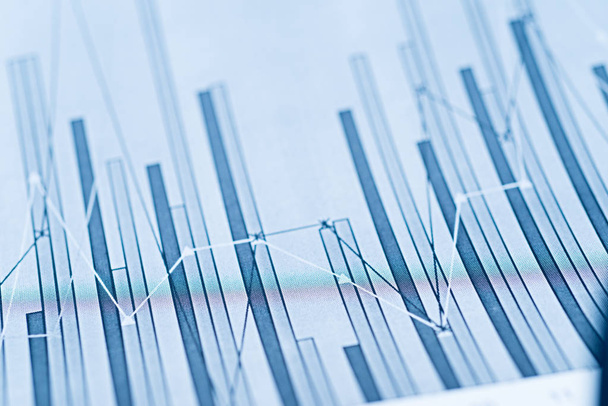
Graphic detail stock exchange market indicators

Ruble exchange rate on international stock exchanges

Stock market chart, graph on blue background. Stock market graph on the screen. Stock exchange graph
Display of Stock market quotes. Business graph. Bullish Bearish trend. Candlestick chart uptrend downtrend

Financial data on a monitor. Stock market concept. Fundamental and technical analysis concept

Red and blue candlestick graph focus gap on graph. Business and financial concept
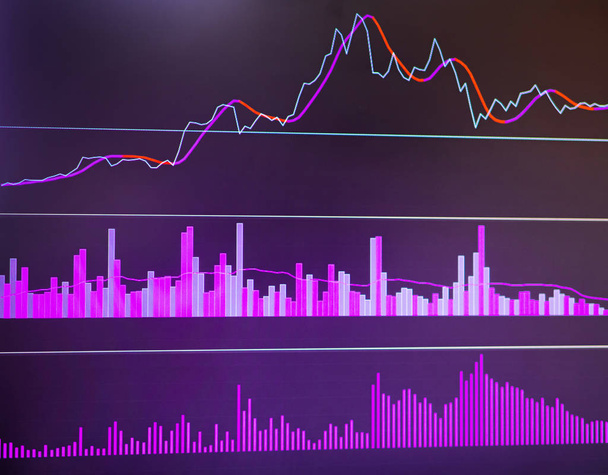
A histogram with indicators in an online application for trading on the stock exchange or cryptocurrency exchange, without leaving home with up-to-date information. The concept of earning online.

Flag of Germany on bar chart concept of economic recovery and business improving after crisis such as Covid-19 or other catastrophe as economy and businesses reopen again.

Charts of financial instruments with various type of indicators. World economics graph. Conceptual view of the foreign exchange market

Red and blue candlestick market charts on computer display. Business analysis diagram
A close-up financial chart with an uptrend line candle chart on the stock or cryptocurrency market on a black monitor background. Investment chart of the stock or cryptocurrency market with indicators
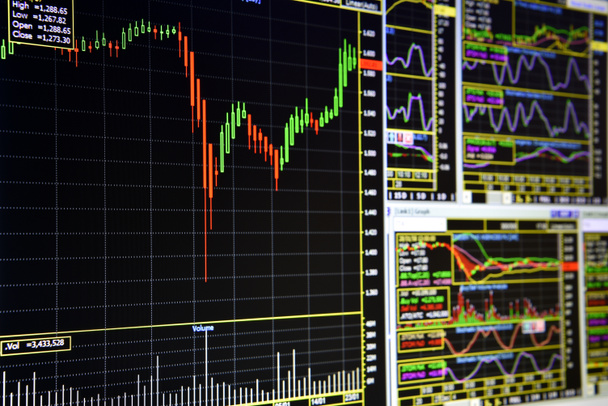
Charts of financial instruments with various type of indicators for technical analysis on the monitor of a computer.
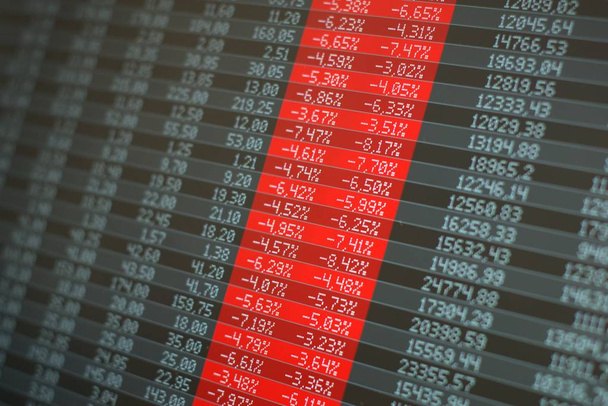
Stock market crash, panic. Computer screen showing red negative numbers across the board.

Stock market candlestick chart on blue background

Close up of finance business graph which including of Up trend and Down trend. Analyzing financial data

Technical analysis diagram. Finance background data graph. Stock market and trading concept

Graphic detail stock exchange market indicators
Stock market data candlesticks are indicators of the rising stocks on the background of high-tech technology finance. technology communication concept.

Charts of financial instruments with various type of indicators for technical analysis on the monitor of a computer
Display of Stock market quotes. Business graph. Bullish Bearish trend. Candlestick chart uptrend downtrend

Graphic detail stock exchange market indicators
Graphic detail stock exchange market indicators

An image of a screen featuring a chart of an index or an other asset in a charting application

Graphic detail stock exchange market indicators

Graphic detail stock exchange market indicators

Graphic detail stock exchange market indicators

Graphic detail stock exchange market indicators

Stock market and other finance themes. Financial data on a monitor. Finance data concept

Graphic detail stock exchange market indicators
War causing economic crisis with stock market chart arrow down in red negative territory over Russian flag painted on wall with shadow of soldier. Economy problem due to Russian invasion in Ukraine.

Charts of financial instruments with various type of indicators including volume analysis for professional technical analysis on the monitor of a computer. Fundamental and technical analysis concept

Stock market and other finance themes. Financial data on a monitor. Finance data concept

Flag of India on bar chart concept of economic recovery and business improving after crisis such as Covid-19 or other catastrophe as economy and businesses reopen again.

Stock market chart on computer display. Business analysis diagram. Fundamental and technical analysis concept

Graphic detail stock exchange market indicators

Ruble exchange rate on international stock exchanges

Charts of financial instruments with various type of indicators for technical analysis on the monitor of a computer.

Finger touch on screen with stock market data

Financial data on a monitor. Stock market and other finance themes

Stock market candlestick chart on blue background

Graphic detail stock exchange market indicators

Abstract financial trading graphs on monitor. Background with currency bars and candles

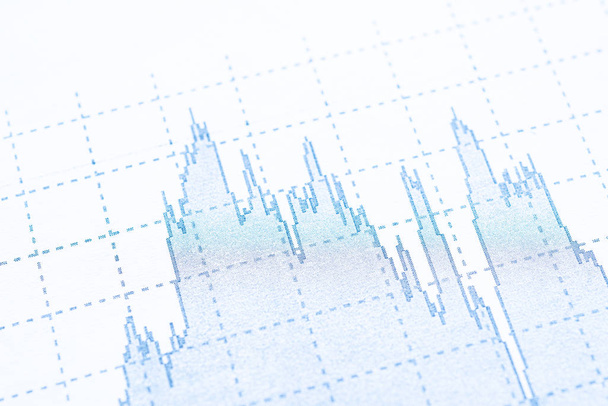
Graph with growing indicators and high growth dynamics on a blue background. High income, rising prices.

Business analyzing financial statistics displayed on the screen. Finance data concept
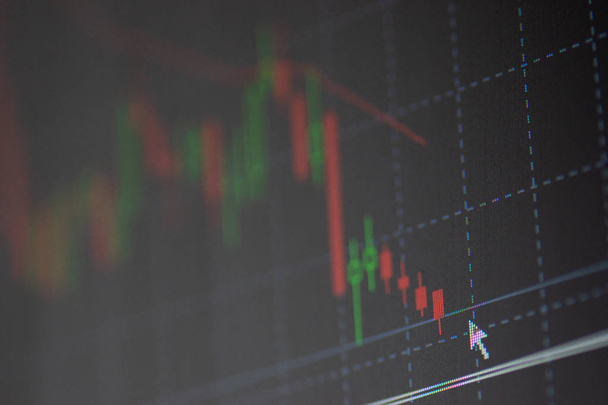
Candlestick chart of bearish trend. Mouse pointer at the candle. Falling price. The moving average is visible.

Flag of Japan with a large display of daily stock market price and quotations during normal economic period. The fate and mystery of Japan stock market, tunnel/corridor concept.

Graph of Cryptocurrency market. Finance business data concept. Stock market graph on the screen. Background stock chart. Stock market graph and bar chart price display

Holographic chart with rising rates and indicators. Business growth concept, high profitability, successful startup. The growth of the exchange rate

Financial graphs and charts for analyzing data. Bullish point, Bearish point. trend of graph
Graphic detail stock exchange market indicators

Display of Stock market quotes. Business graph. Bullish Bearish trend. Candlestick chart uptrend downtrend

Economic growth and investment. Euro bills and charts and graphs of financial indicators
Stock market graph on computer display. Business analysis diagram. Fundamental and technical analysis concept. Charts of financial instruments with various type of indicators
Charts of financial instruments with various type of indicators including volume analysis for professional technical analysis on the monitor of a computer. Fundamental and technical analysis concept

Picture of a vehicle speedometer from 80km/h to 120km/h

Graphic detail stock exchange market indicators
Economic crisis with stock market chart arrow down in red negative territory over European Union flag painted on wall. Business and financial money market downturn concept in EU.

Close up of finance business graph which including of Up trend and Down trend

Graphic detail stock exchange market indicators

Graphic detail stock exchange market indicators

Business analysis diagram. Finance background data graph. Stock market concept

Business analysis diagram. Finance background data graph. Stock market concept

Highlighted speedometer on the control panel

Graphic detail stock exchange market indicators

Russian ruble banknotes against backdrop of falling red currencies graphic. Concept economic default, oil.

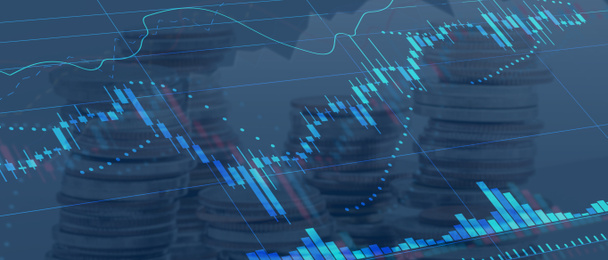
Double exposure stock graph indicator and cityscape view in blue background, business or financial chart concept 3

Graphic detail stock exchange market indicators

Graphic detail stock exchange market indicators

Car speedometer and dashboard at night illustration
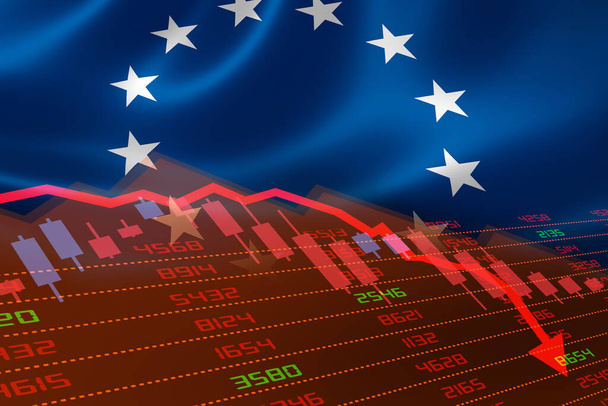
European Union economic downturn with stock exchange market showing stock chart down and in red negative territory. Business and financial money market crisis concept caused by Covid-19 or other catastrophe.

Graphic detail stock exchange market indicators

Graph with growing indicators and high growth dynamics on a blue background. High income, rising prices.

UK economic downturn with stock exchange market showing stock chart down and in red negative territory. Business and financial money market crisis concept.

Safe investment in stock market crash, concept. Red negative prices and a single winning stock in green.

Plan growth and increase of positive indicators in his business. Hand holding digital graphic pen and drawing digital hologram growth graph chart sign on city dark blurred background

A closeup section of a digital stock market indicator board with green and red numerical figures
Graphic detail stock exchange market indicators

Holographic chart with rising rates and indicators. Business growth concept, high profitability, successful startup. The growth of the exchange rate

Financial chart with growing indicators, growth dynamics in business. High margin
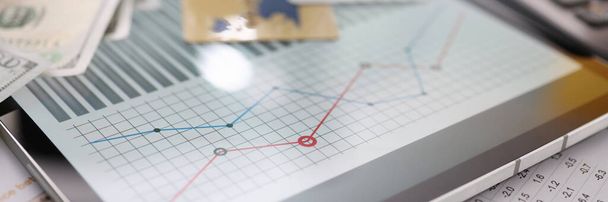
On table is tablet with commercial indicators of bank cards and banknotes. Financial reports concept

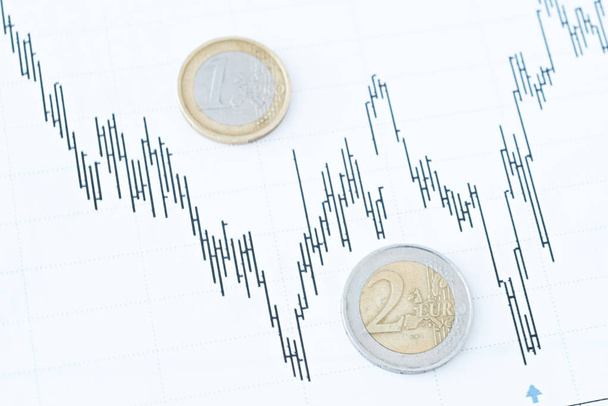
Euro and Swiss Franc coins, price trend. Euro that is weakening, Franco that is strengthening. Euro vs CHF.

Russia economic downturn with stock exchange market showing stock chart down and in red negative territory. Business and financial money market crisis concept.
Graphic detail stock exchange market indicators

Gray gasoline sensor in a car

Financial chart with growing indicators, growth dynamics in business. High margin

3d illustration of graphs of growth of economic indicators isolated on a white background. Financial development statistics of the company.