Create
Creative AssetsTutorialsPricing


More
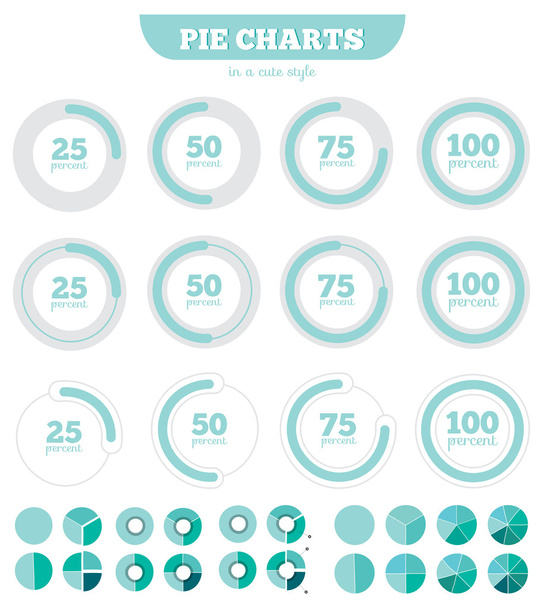
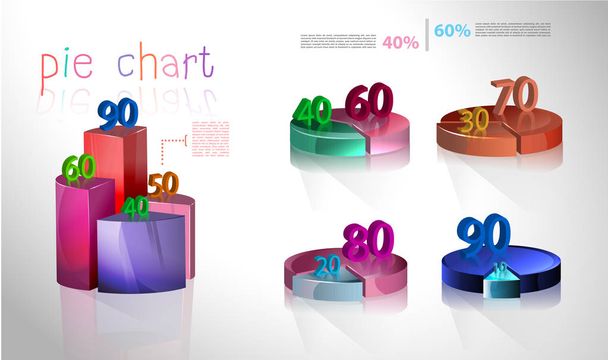
VistaCreateUnlimitedVectorsSet of business cycle flow diagrams, pie chart for documents,reports,presentations,infographic,0 5 10 15 20 25 30 35 40 45 50 55 60 65 70 75 80 85 90 95 100 percent clock style. Vector illustration.


Set of business cycle flow diagrams, pie chart for documents,reports,presentations,infographic,0 5 10 15 20 25 30 35 40 45 50 55 60 65 70 75 80 85 90 95 100 percent clock style. Vector illustration. - Vector Image
By dreamdepo 5000x5000 px
Stock Vector ID: 256442764
Free for use in the editor and download.

Free for personal and commercial purposes with attribution.
Attribution after download is required.
This site is protected by reCAPTCHA and the Google
Privacy and Cookie Policy and Terms of Service apply. from
Similar Royalty-Free Vectors

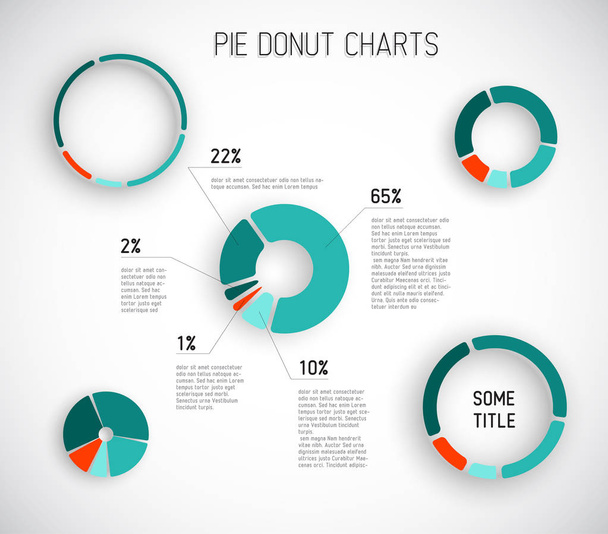
Colorful Vector Donut pie chart templates for your reports, infographics, posters and websites

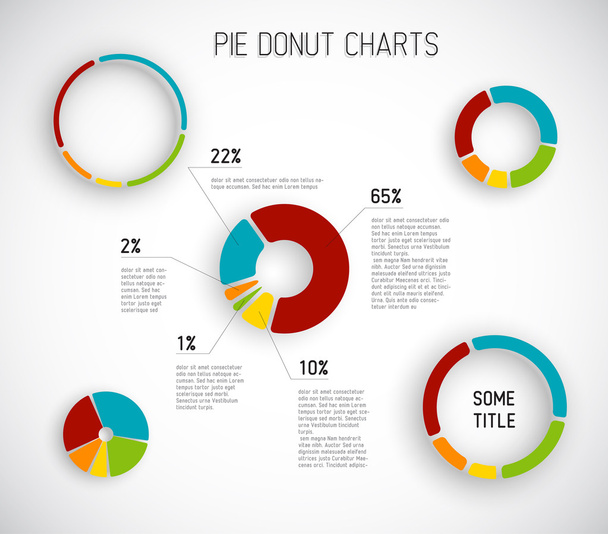
Colorful Vector Donut pie chart templates for your reports, infographics, posters and websites
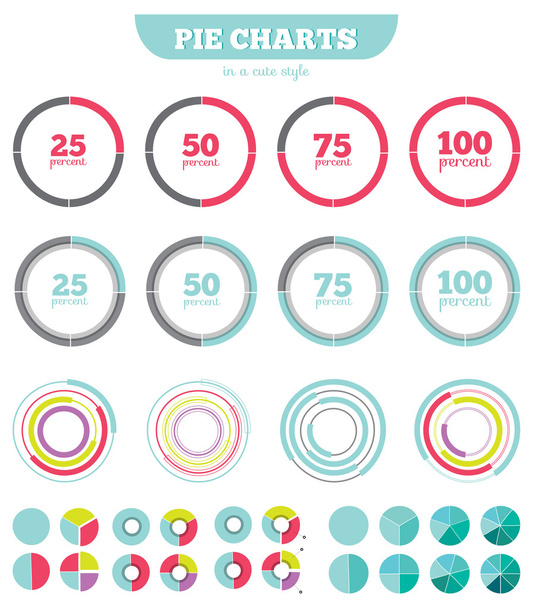
Colorful Vector pie chart template for your reports, infographics, posters and websites - red and teal version


3D pie chart infographic for used presentation. vector illustration.


Show more


Stock Vector Tags
Bar
Vector
Round
Background
Circle
Graphic
Element
Illustration
Design
Set
Business
Percentage
Abstract
Pie
3d
Modern
Symbol
Concept
Flow
Icon
Percent
Data
Clean
Information
Presentation
Web
Finance
Template
Marketing
Cycle
Layout
Plan
Report
Organization
Graph
Chart
Circular
Brochure
Slide
Progress
Statistics
Info
Diagram
Options
Charts
Workflow
Timeline
Infographics
Infographic