Create Infographics to Present Data in Style
Infographic maker for easy design


Top tools for making a custom infographic online
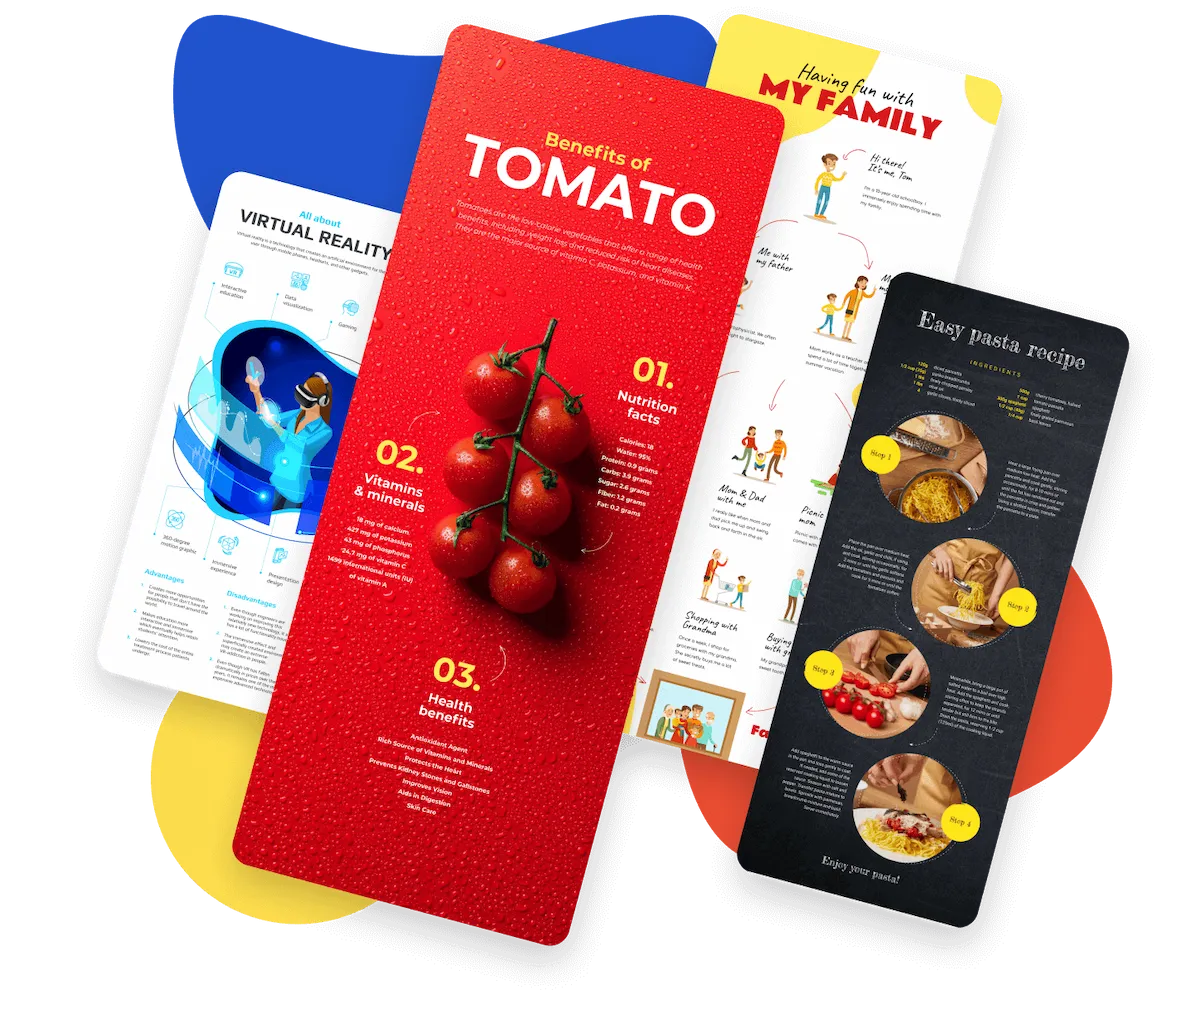
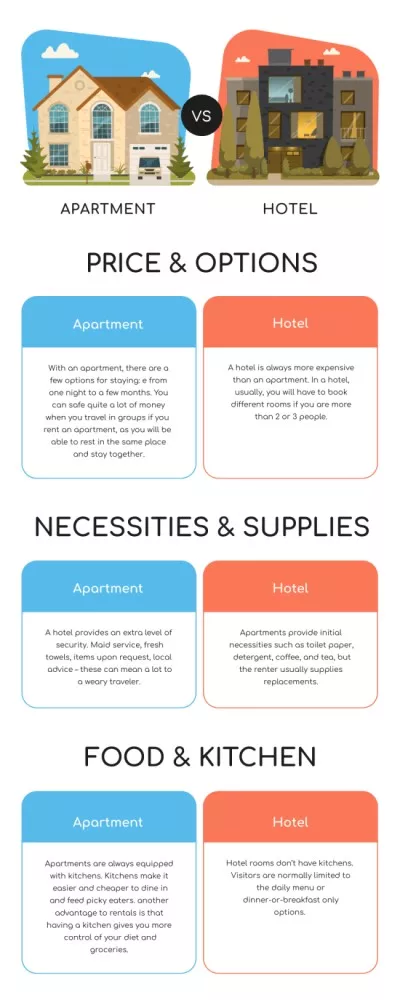
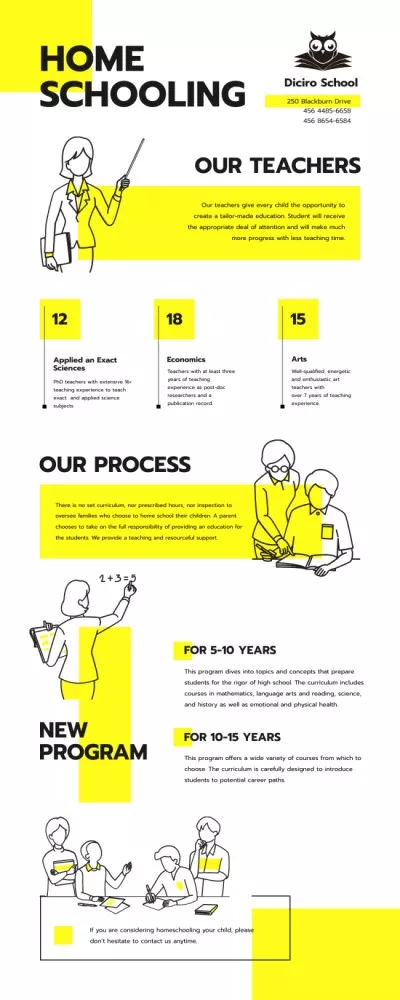
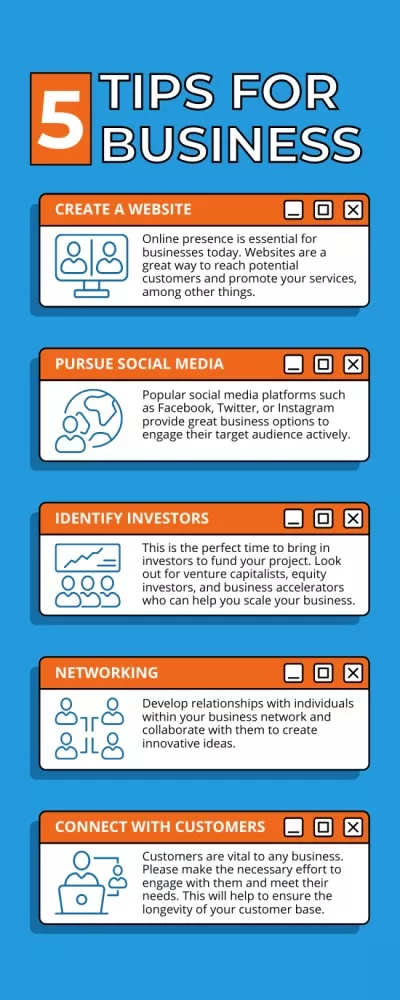
Professional infographic templates


Animate your design
Play with fonts


Add design objects

Upload my content


How to make infographics in VistaCreate
-
Step 1
Choose a template
Browse ready-made templates to start your infographic design.
1. Sign up for VistaCreate. Or, log in to an existing account if you already have one.
2. Choose a desired format. Enter “infographic” into the search bar on the VistaCreate homepage. Select a format you need.
3. Explore infographic templates. Select a template that works best for your creative idea, business, or industry. -
Step 2
Edit your template
Customize your selected design in VistaCreate.
1. Change the color scheme and fonts. Edit colors and fonts in your infographic to match your style. You can upload your own typography if needed.
2. Edit text on the template. What is your infographic about? Add your own text to make your design as practical as can be.
3. Add design elements. Enhance your infographic with arrows, shapes, icons, and other design objects from our media library. -
Step 3
Download or share
Download your infographic or share it online.
1. Collaborate on your infographic. Create a team account in VistaCreate and invite up to 10 members to collaborate on designs.
2. Download your project. Once you’re done editing, download your presentation in a desired format. You can select JPG, PNG, and other formats.
3. Share your design. Copy a link to your infographic and share it online via social media or email.
Essential tips for a great infographic
-
Less is more
You don’t need to write three pages of text to explain the facts. Infographics are all about simplicity. The less you write, the easier it will be for the reader to understand the information. Besides, people process visual information faster than text, so focus on illustrations.
-
Turn words into numbers
Every word that can be written in number form should very well be. Use symbols for quarters and percentages to have a less-cluttered infographic. Plus, your infographic will look more scannable and catchy with interesting data in numbers.
-
Emphasize important details
For a more legible infographic, accentuate key elements like headings, badges, and numbers. This will help the reader intuitively understand the most important thing to remember. Use fonts, colors, and objects to help reinforce your infographic’s key messages.
-
Have fun
Let’s not forget that infographics usually contain quite serious and valuable information. It’s up to you to leave it as raw as the report states or to make it more entertaining with the help of fun stickers. Search for exciting facts to support your raw data, and illustrate them using our fun illustrations and objects.
FAQ
-
What makes a good infographic?
To create an infographic that grabs attention, make it scannable and legible. Use simple fonts, bold or muted colors, add lots of visuals. Don’t clutter your design with text. Leverage white space to help guide viewers to the right information. Keep in mind that it’s important to only use high-quality images in your infographic. VistaCreate offers a vast library of high-resolution stock images, videos, and vectors for infographic creation. Explore millions of royalty-free files in the best free infographic maker and enhance your data visualization. -
Can I use my own images to create an infographic?
Absolutely! You can upload images, videos, fonts, and other content to the VistaCreate free infographic maker and use them in your designs. To do so, open the infographic creator and go to the “Uploads” tab on the sidebar menu. Click “Upload Image or Video” to add your files to the editor. Now you can create an infographic using your content: simply place the uploaded items anywhere on the artboard. -
Can I animate my infographic in VistaCreate?
Yes! You can add videos to your project or animate it in VistaCreate. To add videos, upload them to the editor by clicking “Upload Image or Video” in the “Uploads” tab. Note that you can also use files from our collection. To animate your design, click the “Animate” button and experiment with different effects. You can apply them to any design element on the template. -
What is the best size for an infographic?
The size of your infographic depends on the platforms you want to share it on. In the VistaCreate infographic maker, you can easily resize your design to fit the desired publishing channel. Use preset design formats to quickly adjust your infographic to social media, blogs, or other channels. You can also set custom dimensions to create an infographic in a variety of sizes using the free infographic maker. -
What are the best practices for infographic designs?
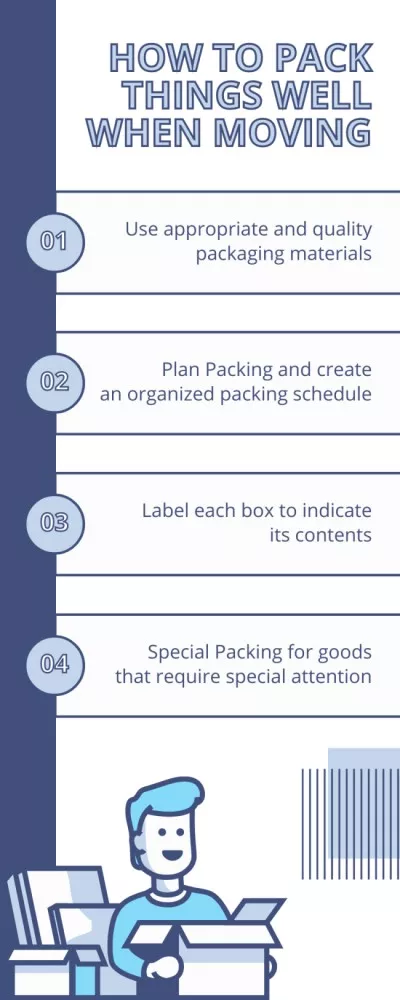
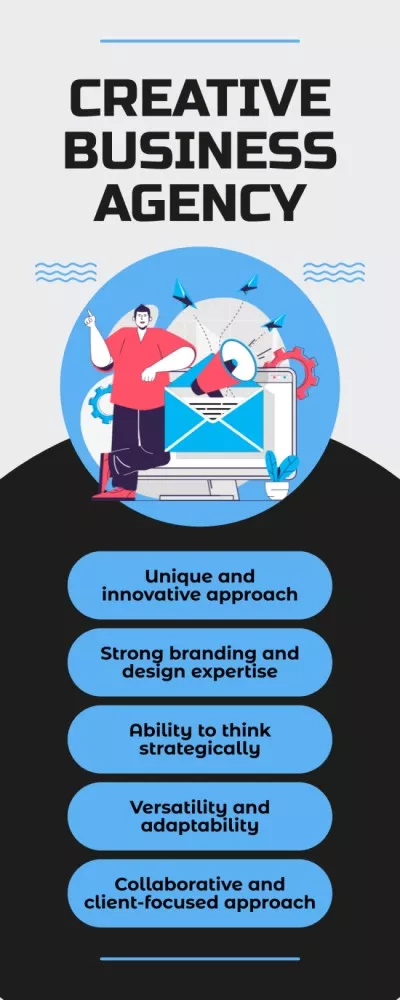
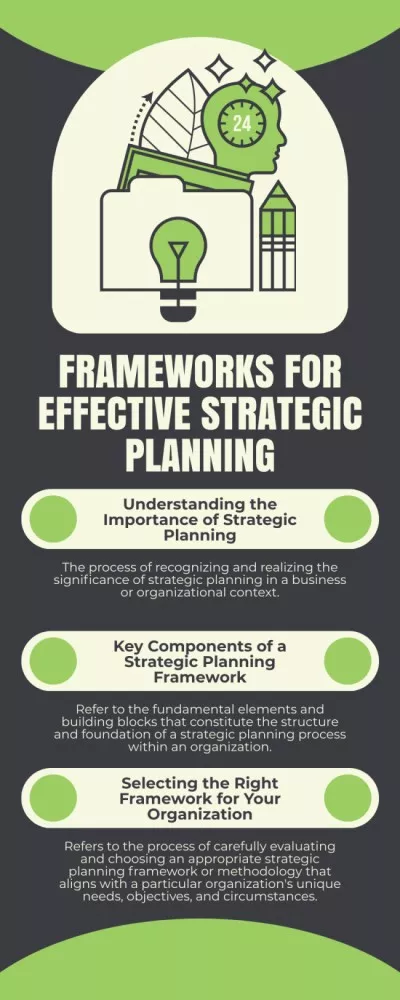
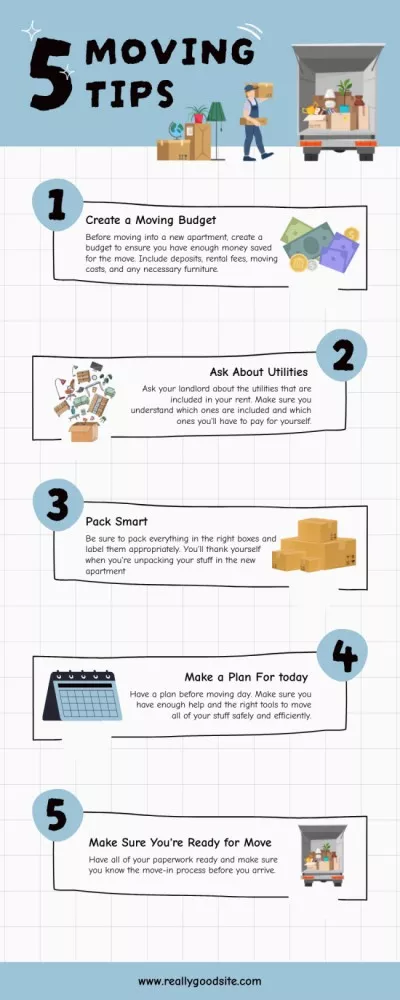
There are several types of infographics that you can use for your business. Lists, how-tos, timelines, mind maps, and flowcharts are best if you need to visualize data in a simple and creative way. You can find any infographic template you need in VistaCreate. Just open the editor and enter your keyword into the search bar on the main page. -
Can I post my ready-made design on social media?
Sure! Create a project using our infographic tool and quickly resize it to any format you need. You can adjust your visual to Instagram, Facebook, Pinterest, or even printable formats right in the editor. Just find the “Resize” button on the header menu and select your desired size. You can also animate your project to post it on TikTok or YouTube as a video.
Inspiring infographic ideas
Thousands of design templates


What our users say about VistaCreate


Featured on