We all share a great love for infographics — they’re fun to examine, and easy to read and digest. They also have great business potential, and experienced marketers know the power of this visual tool well. But being a small business owner, do you actually know how to use an infographic for marketing and promo?
You might be completely new to infographics.
And before you invest your time in creating one, you might need a guide on what types of infographics exist and when to use them, right?
This article will walk you through 9 of the most popular types of infographics, and explain why to use them and when. But first…
What are the benefits of infographics for marketing?
Infographics and effective marketing go hand in hand. There’s a whole list of benefits marketers can leverage with infographics:
- Infographics are 30 times more likely to be read than text articles;
- Using this visual tool, you can prove your expertise on a topic;
- Infographics boost reading comprehension by 50%;
- People love sharing infographics, so it boosts brand awareness and brings in more new customers;
- Infographics filled with keywords improve your page ranking on Google.
… just to name a few.
Therefore, it comes as no surprise that companies use infographics to get more attention from prospects, educate their customers, and communicate important messages. This is exactly what you need for your business.
Let’s learn the most popular types of infographics and find ones that will work best for your marketing and promo strategies.
The 9 infographic types [+ free templates]
#1 – Informational infographic
An informational infographic is best used when you need to provide customers with a quick overview of a topic. For an infographic like this, use minimum text, but focus on graphic elements and icons. Place emphasis on the simplicity and memorability of the picture. Here are some examples:


Here’s an example of a informational infographic from Drive Dunes:
Add creative fonts, vector images, and photos to make your infographic both informative and aesthetically pleasing. Eye-catching design makes the best advertising infographic. Give it a try in your online and offline promo materials.
Pro tip: Remember, users like sharing images on the internet. So, add your brand logo and website to your infographic for extra coverage.

#2 – Statistical infographic


Statistical infographics deliver information based on precise numbers — survey or research results, updated data from various sources, etc. A well-designed statistic infographic makes it easier for customers to visualize and remember numbers that are usually hard to process.
This type of infographic doesn’t have to be boring. Experiment with fonts and colors, and add photos to draw viewer attention. Just like in this example:

Use statistical infographics to share facts about your brand or product, and show your business growth on social media, websites, blogs, etc. Statistics are also at the core of a target market infographic, which you might need for investor presentations, crowdfunding pages, annual reports, etc.
#3 – Comparison infographic
The comparison infographic is self-explanatory and very convincing, making it one of the best business infographics for marketing. Compare two or more topics to one another and showcase their differences using simple graphics, comprehensive charts, and numbers.
Use it for:
- Explaining pros and cons
- Showing similarities/differences between two or more topics, concepts, and products;
- Helping readers understand multiple perspectives.


With comparison infographics, small business owners can convincingly demonstrate the benefits of their products or services, and help their customers make informed decisions. A key point with this type of infographic is to contrast the two competing options by clearly separating them for the reader. For that, split the image into sections vertically or horizontally, group text blocks in boxes and bubbles, and use contrasting colors for different options.
Look at this template where we compare Abstract art and Cubism. The infographic displays the main characteristics of these art movements and contains photos of art pieces. Try the same trick when creating your design.

#4 – Visual article infographic
While some people like to learn new information from articles, others prefer visuals to long reads. That’s just how people are. Thus, convert your written piece into effective infographics if you want to deliver your ideas and boost article shareability. By summarizing a big portion of information into a simple infographic design, you can help people consume important content faster.


Opting for this type of marketing infographic, you usually combine several graphics relevant to the content of the article. For example, provide statistics on the topic, explain the steps of the process, and share tips — all in one visual article infographics. This way, you can maintain the reader’s attention for longer and deliver your ideas in the most digestible way!

Use a visual article infographic to tell the story of your brand and product, explain trends or complex topics, and visualize articles with loads of text. It works perfectly for cross-posting, social media, email marketing, brochures, posters, and other printables.
Browse our templates for infographic topics ideas and inspiration.
#5 – Process infographic
According to this statistic, people who follow directions with both text and illustrations do 323% better than people following directions without illustrations. To put it simply, if you want to explain a process to your customers, an infographic is the way to go.


To understand how to deliver this information, put yourself into your customer’s shoes and condense the whole process into 3 or 5 steps. Explain it as simply as possible and visualize each stage using numbers and icons.
Pro tip: Organize text blocks in an S-shape to fit all the steps on the same page. Add arrows, dots, and lines to encourage readers to follow the process correctly.

The visualized followthrough is perfect for infographic content marketing that helps educate your customers on how to use your product. Create a design with instructions and include it with orders. Also, use it for online stores and post it on social media.
#6 – Simplifying the сomplex infographic
When you need to convey complex information to potential buyers or investors, choose this particular type of infographic. Yes, it looks much more complicated than other types, as it focuses on deeper topics or complex industries. However, a well-done infographic makes such issues much easier to understand, even for non-professionals.


Our templates above explain complex things like how VPN technology and the oil industry work based on simple graphic elements without in-depth explanation. Repeat the same trick in your infographics — condense all the main points of your topic into an easy overview and present them visually. This way, you can introduce a new subject to your target audience and showcase issues as approachable. Include this infographic in your article or presentation.

#7 – Timeline infographic
A timeline infographic helps visualize the history or progression of something. Using this visual, you can tell your brand’s story from day one and guide readers through your milestones. This way, they will see where you are coming from and feel like they’re part of your journey. A timeline infographic is storytelling at its best — text blocks explain the process and accurate numbers help readers clearly understand a timeframe.


The crucial aspect of such infographics is a clear structure and dates. As with progress infographics, it is important to use arrows and lines to tie all the events into one cohesive story.

Use timeline infographics for social media marketing, catalogs, presentations, and your internal business processes. For instance, include it in your marketing strategy infographic or visualize a project timeline for your team.
#8 – List-based infographic
With a list infographic, you can showcase your product lines, services, and brand activities in one image. Also, try it to share tips, examples, trend overviews, etc. In fact, if there’s any helpful information you can present in the form of a list, it’s better to translate it into an infographic.


Minimize text descriptions and arrange them in small boxes across the page. Be sure to number all the items on the list in big, bold fonts. Also, replace bullet points with graphic icons, and add photos or hand-drawn graphics. Just like in the following image.

The list infographic is great for printed collateral, i.e., posters, catalogs, flyers, etc. Being eye-catching, it also works perfectly for social media posts and emails. Since people don’t read long emails, a list infographic can be the best way to deliver your message to customers and stand out from other emails in their inbox.
#9 – Map infographic


A map infographic is best for illustrating demographic data or location-specific information.
Use it to show the results of statistics based on location; illustrate the region’s features, global, and local trends; and so on.
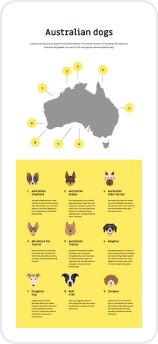
Most often, a map infographic is combined with other infographic types. For instance, with statistics (example above), or with a list (following example):

Include a map infographic in your articles about global trends or local businesses. Use it as a part of your product storytelling to explain where your produce comes from. Also, mark your business network across the country. The map gives customers an overview of your business geography and helps them remember key features of your product.
How to make infographics in VistaCreate in 5 steps
VistaCreate makes the process of creating infographics extremely easy. In fact, you only need to go through 5 basic steps to get a quality, professional-looking infographic for your business’ marketing purposes:
- Start a project
- Click on Blank infographic or select a ready template
- Add your photos and vectors, or use files from our library
- Tailor text to your needs
- Download the result
In conclusion…
The obvious tip on how to use infographics is to choose a type based on the purpose. When contrasting two or more options, opt for a comparison infographic. If you need to explain the assembly process or how your technology works, visualize it all in a process infographic.
Also, be aware of your target audience — buyers want a fun infographic, while investors expect in-depth research.
In 2022, people will focus more on visuals, so we encourage you to switch to infographics to maximize the chances of being seen. Experiment with different infographics using our free templates. We made all the elements customizable, so you can easily tailor them for specific businesses and goals.

