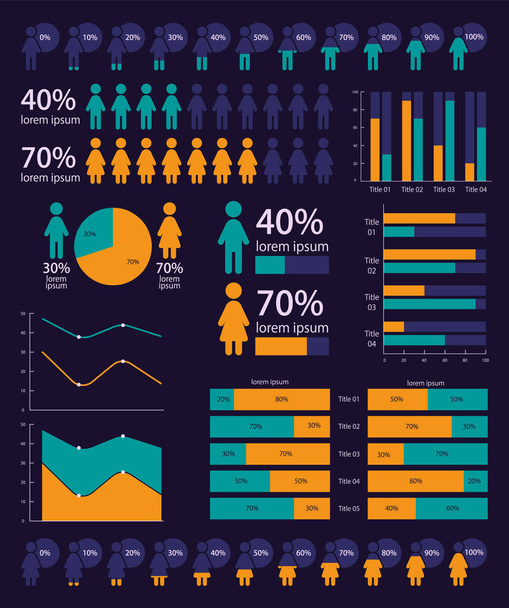


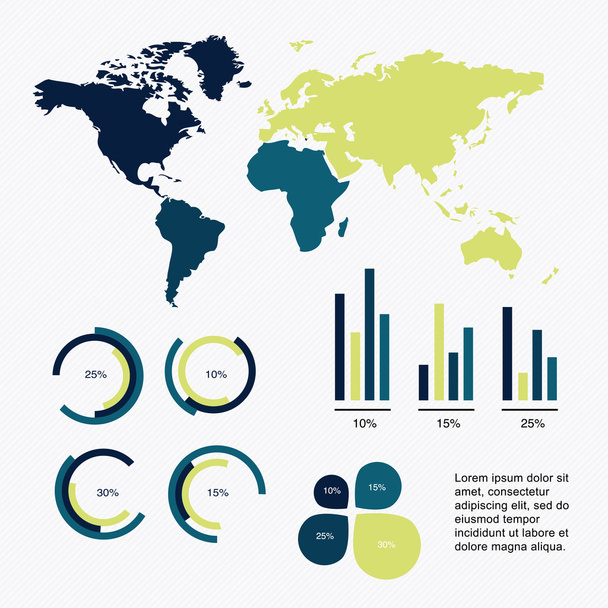
World demographic analytics infographic chart design template set. Presentation materials. Visual data presentation. Editable bar graphs and circular diagrams collection. Myriad Pro font used - Vector Image
By bsd_studio 5000x4140 px
Stock Vector ID: 662690736
Free for use in the editor and download.

Free for personal and commercial purposes with attribution.
Attribution after download is required.

Similar Royalty-Free Vectors
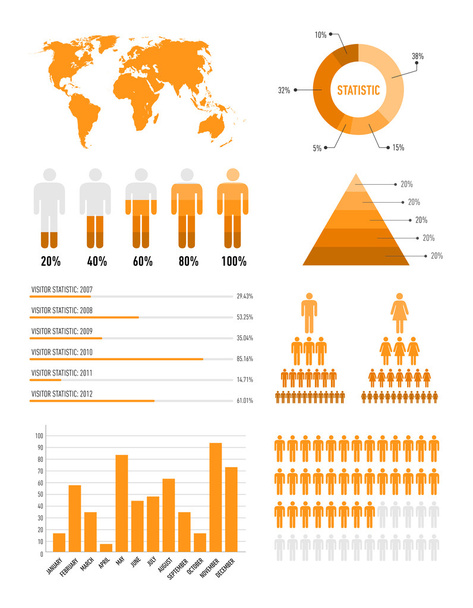
Orange infographic elements for the web and print

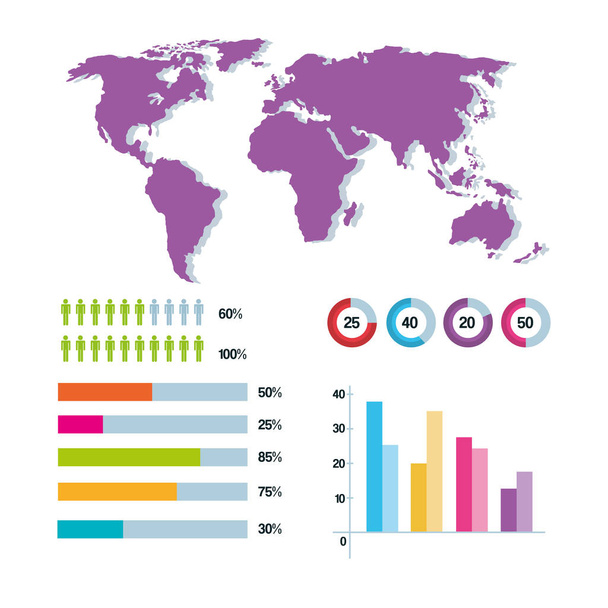
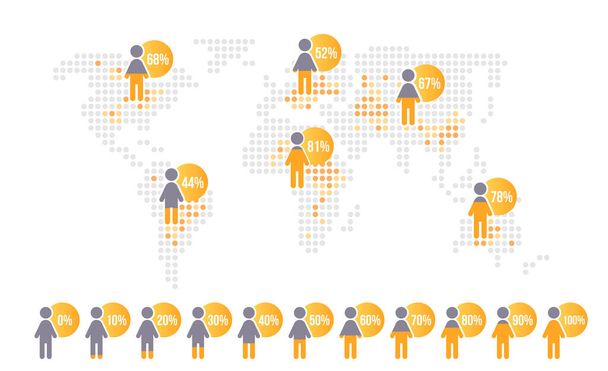
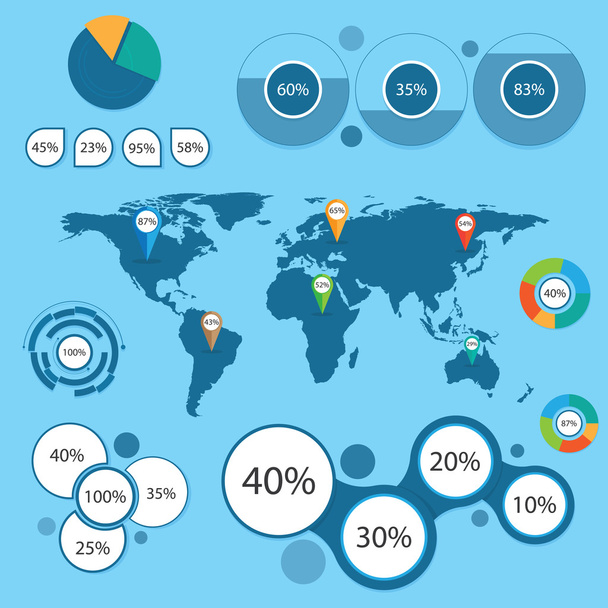
World map infographic information report network vector illustration
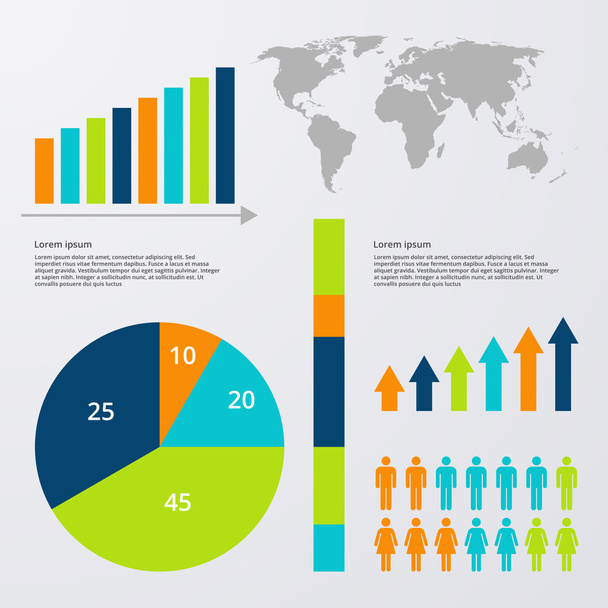
Bar Chart Graph Triangle Pyramid Statistical Business Infographic
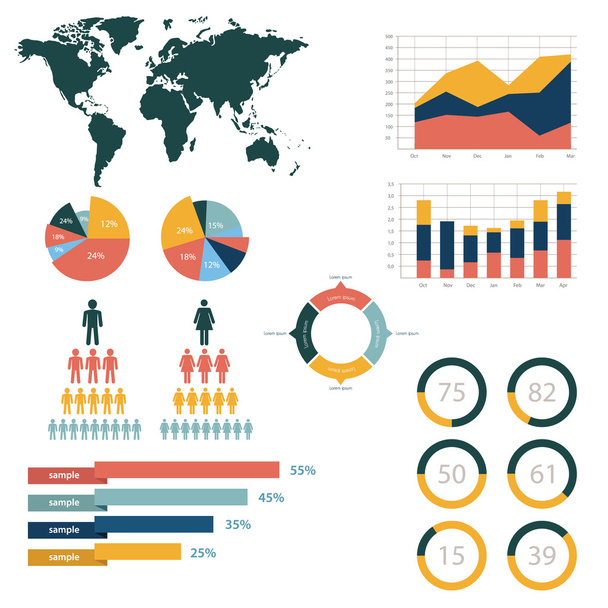
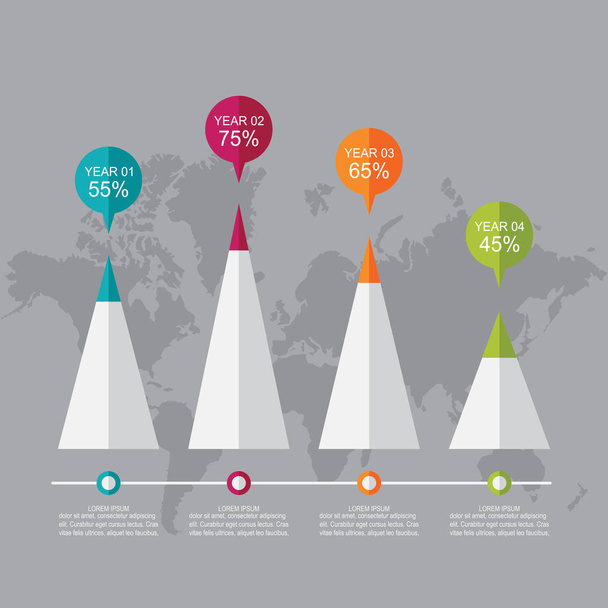
Retro infographics set, vector illustration
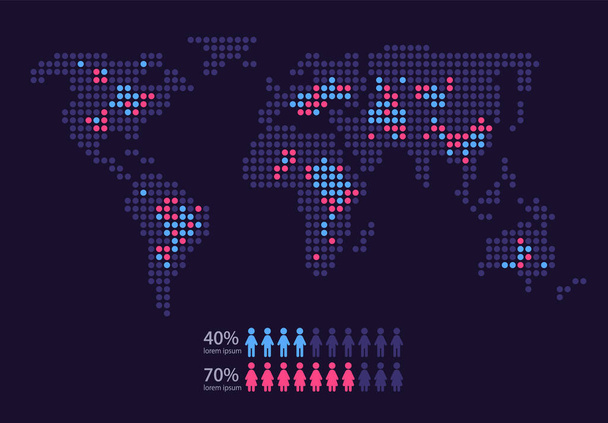
Stock Vector set of infographics with map.

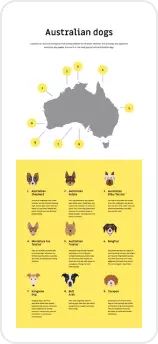
Business economy nature beauty animals food drinks cat dog the company income ecology water savings black planet infografics

Retro infographics set. World Map and Information Graphics.

Business economy nature beauty animals food drinks cat dog the company income ecology water savings black planet infografics