


Filters

Stock royalty-free photos and images of Diagrams
Discover unlimited high resolution images of Diagrams and stock visuals for commercial use.


Businessman presenting business concept of his own hands

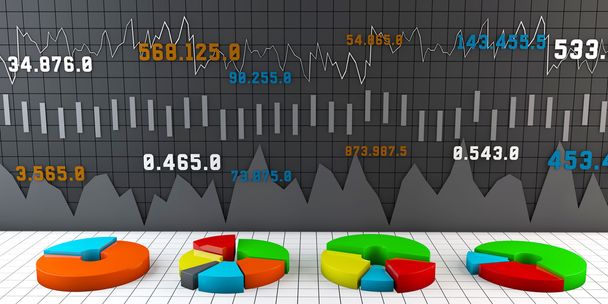
3d Illustration of Colorful Business Chart, Reports and Presentations

Sales Annual Report in Graphs and Diagrams


Business still-life with diagrams, charts and numbers.

Top view office table desk. Financial report. Flat lay. Workspace with Business office supplies, Accounts number on the data paper, diagrams, calculator. Copy space for text. Top view

Overhead view of businesspeople working with devices while businesswoman resting with laptop on legs
Desktop with a chart sheet, the recording sheet and hand with pen

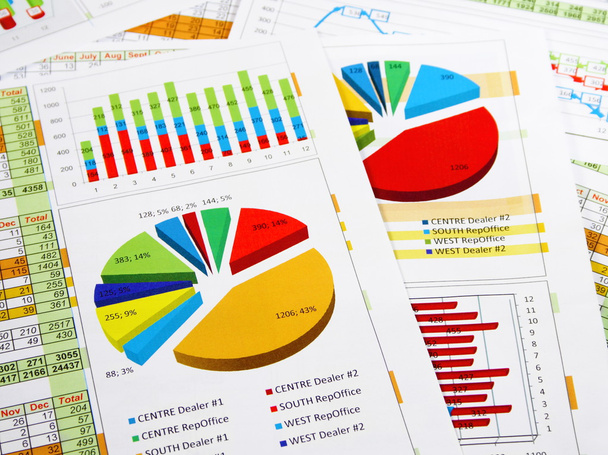
Financial printed paper charts, graphs and diagrams on the table


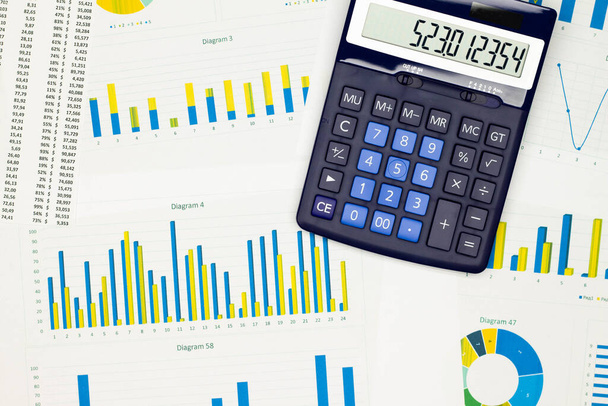
Document with statistics of visitors views, calculator and pen


Business charts and diagrams on digital tablet.

Business goal concept. Close-up business accessory, diagrams graphs, glasses, smartphone and highlighter pen on table.


Business person touching colorful charts and diagrams


Financial crisis. Figure of businessman on financial charts


Businessman holding business diagrams, concept of success


Detailed financial plan in the hands of a businessman


Business woman touching colorful charts and diagrams

Business document Financial chart and graph.


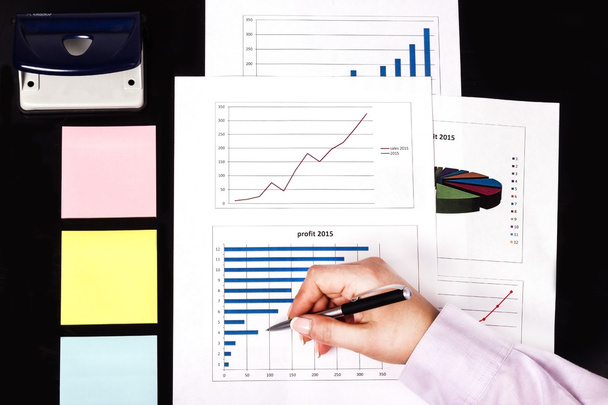
Businessman's hand showing graph on financial sells or popularity report with pen. Diagrams are printed and helpful in showing analyzes data in clean graphical form in business conferences, board meetings, trainings and presentations.


Financial diagrams and dollar banknotes close up

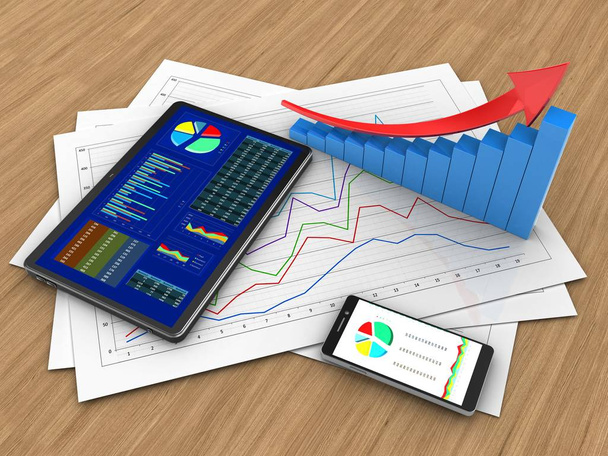
3d illustration of diagram papers and tablet over wood background with arrow graph


Computer keyboard with business diagrams , e- commerce concept


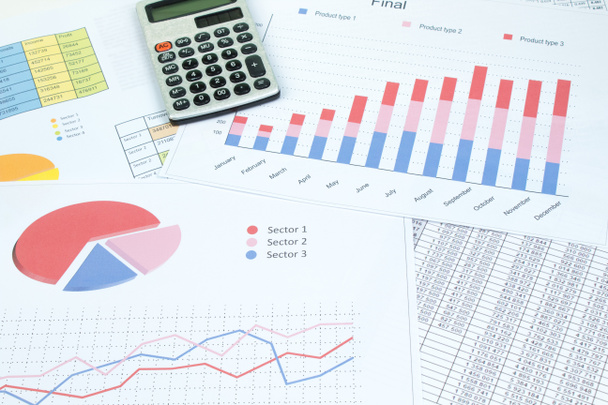
Document showing a bar graph, pie graphs and a fluctuating chart depicting business performance, planning, projections and strategy


Tablet with infographs in business person hand. Media technology concept presented by businessman holding tablet with graphs and diagrams


Businessman Showing Important Diagrams And Pointing On Save Button.


Double exposure Economics growth diagrams on blurred background. Business and investment concept


Business workplace with keyboard and papers with graphs and diagrams


Growing graph - 3d business concept illustration


Financial crisis. Figure of businessman on financial charts


Laptop computer and modern digital tablet with business charts and diagrams on a screen


Hand holding a black smart phone with graphs and charts elements on screen. Isolated on white background. All screen content is designed by me.


Businessman holding business diagrams, concept of success


Showing business and financial report. business Concept

3d infographics set of colorful 3d render diagrams icons for your business presentations.


Open book with QUALITY CONTROL inscription, new business concept


Business person touching colorful charts and diagrams


Financial stock trading graph chart diagram business finance concept double exposure mixed media


Businesswoman With A Tablet And Pen Presenting Important Data On Diagrams.


Open book with BEST PRACTICE inscription, new business concept


Laptop computer and modern digital tablet with business charts and diagrams on a screen

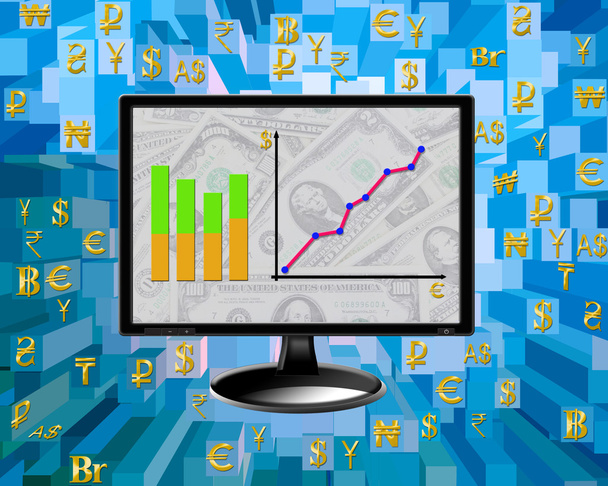
Business concepts diagrams money signs technology on the monitor's screen


Businessman working with virtual screen with charts and diagrams


Tablet pc and digital hologram with graphs and diagrams


Businessman holding business diagrams, concept of success


Man With Pen Pointing On A Chart Showing Crucial Diagrams And Data.


From above set of financial diagrams showing growth in trading market against green background. 3d render


Businessman holding business diagrams, concept of success

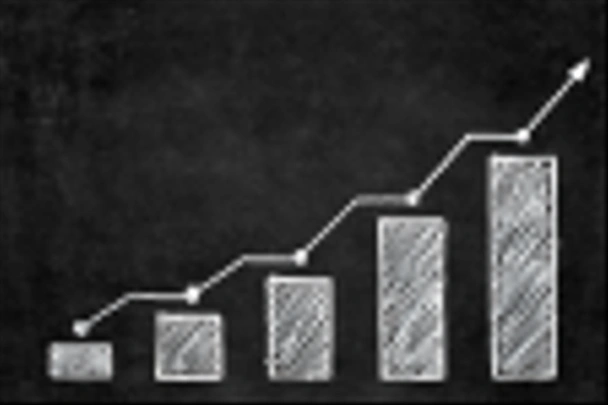
Handwritten chalk drawing graphic growth of success / happiness on blackboard with copy space. Planning concept


Elegant business woman making diagrams on tablet with pencil


Business charts, gadgets and stationery on orange background


Stack of papers. Documents with different diagrams on table. Office concept.


Businessman holding a digital tablet and comparing data with graphics