


Filters

Stock royalty-free photos and images of Intercambio
Discover unlimited high resolution images of Intercambio and stock visuals for commercial use.


Stock trading, crypto currency background.The business plan at the meeting and analyze financial numbers to view the performance of the company.


Graph of stock market data and financial with stock analysis indicator the view from LED display concept that suitable for background,backdrop including stock education or marketing analysis.

Concept of stock market and fintech. Blurry blue digital charts over dark blue background. Futuristic financial interface.


Forex, Commodities, Equities, Fixed Income and Emerging Markets: the charts and summary info show about "Business statistics and Analytics value"


Stock market trade indicator financial for investment strategy. Financial trading graphs on monitor. Background with currency bars and candles


The abstract image of the stock graph on the desktop screen. The concept of financial stock and business


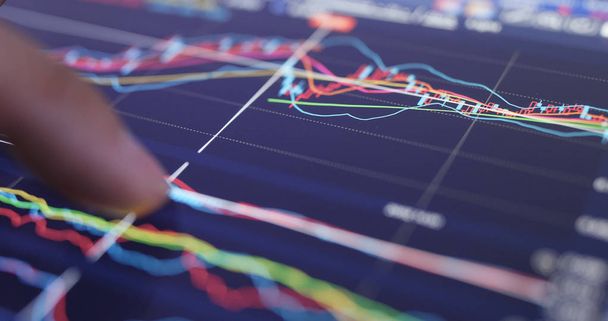
Businessman hand working on analyzing investment charts for Gold market, Forex market and Trading market.


Forex trading graph and candlestick chart suitable for financial investment concept. Economy trends background for business idea and all art work design. Abstract finance background.

Stock market exchange


Stock market price increase


Economic graph with diagrams on the stock market, for business and financial concepts and reports.


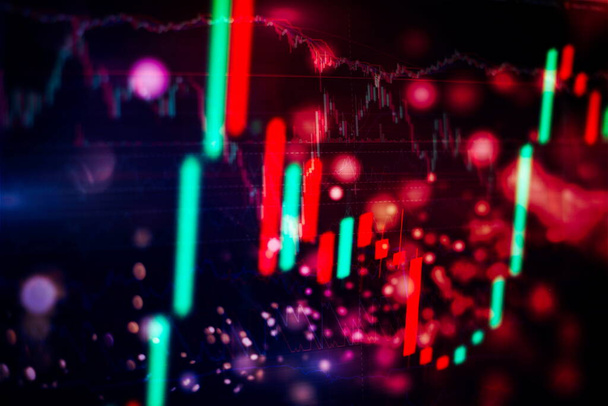
Technical price graph and indicator, red and green candlestick chart on blue theme screen, market volatility, up and down trend. Stock trading, crypto currency background.


Stock market graph on led screen. Finance and investment concept. Selective focus.


Person Using digital tablet for stock market analysis


Data analyzing in Forex, Commodities, Equities, Fixed Income and Emerging Markets: the charts and summary info show about "Business statistics and Analytics value" - Wealth management concept.


Financial graph colorful drawing and table with computer on background. Double exposure. Concept of international markets.

Data on a monitor which including of Market Analyze. Bar graphs, Diagrams, financial figures. Forex chart.


Fintech Investment Financial Internet Technology Concept. Candle stick graph chart of stock market investment trading, monotone color, Bullish point, Bearish point. trend of graph.


Forex chart on cityscape with tall buildings background multi exposure. Financial research concept.


Rising bar graph of stock market investment trading. Computer generated business backdrop. 3d rendering of growing chart


Financial data on a monitor which including of Market Analyze. Bar graphs, Diagrams, financial figures. Forex chart. - Finance data concept.


Financial graph on night city scape with tall buildings background multi exposure. Analysis concept.


Forex chart on cityscape with skyscrapers wallpaper multi exposure. Financial research concept.

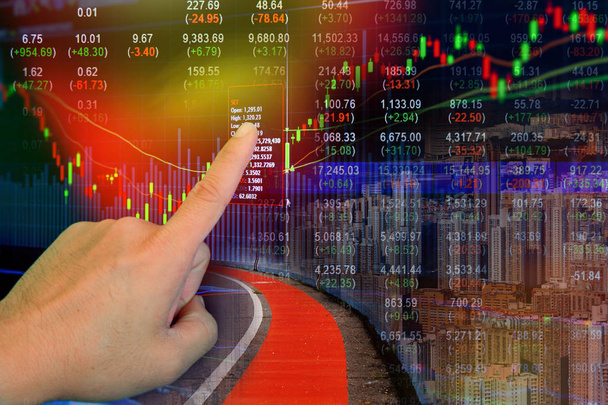
Business candle stick graph chart of stock market investment trading on Cityscape background

Concept of stock market and fintech. Blurry blue digital charts over dark blue background. Futuristic financial interface.


Stock and bitcoin market fluctuation on a screen. Encryption currency prices. - Image


Forex glowing graphs of different colors showing financial market situation on abstract digital background.

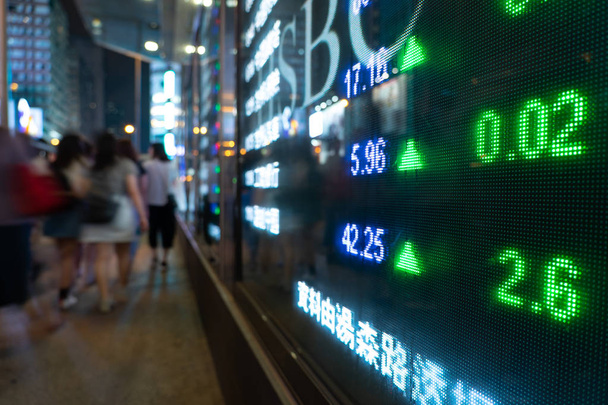
Financial stock exchange market display screen board on the street and city light reflection in Hong Kong


Stock market graph on led screen. Finance and investment concept. Selective focus.


Hong Kong stock market price display at street in the night.

Stock market data on tablet computer


Business diagram on financial report


Double exposure of forex chart drawing and cell phone background. Concept of financial data analysis


Graph with diagrams on the stock market, for business and financial concepts and reports.Abstract blue background.


Stock market price display on road


Stock chart on lcd monitor

Young friends in everyday clothing smiling sincerely and posing on grey backdrop, cultural diversity

The fall of coronavirus exchanges . Data analyzing in Forex, Commodities, Equities, Fixed Income and Emerging Markets: the charts and summary info show about "Business statistics and Analytics value" - Wealth management concept.


Data on a monitor which including of Market Analyze. Bar graphs, Diagrams, financial figures. Forex chart.


Businessman with folded arms on abstract business chart background. Finance and analytics concept. Double exposure


Display of Stock market green quotes on black background, macro

Double exposure dollar bills on forex market chart. stock market financial concept.


A woman hands writing information about stock market in notepad. Forex chart holograms in front. Concept of research. Multi exposure

Double exposure stocks market chart, Stock market data on LED display concept.


Back side of sitting businessman looking at big screen and desktop computer showing the trading graph of stock market exchange graph background, Business trading and finance concept


Forex, Commodities, Equities, Fixed Income and Emerging Markets: the charts and summary info show about "Business statistics and Analytics value"


Stock market number display on the screen


Display of Stock market quotes


Hand hold smart phone on stock market indicator and financial data background for your design. Double exposure financial graph and stock indicator. Abstract stock market financial indicator background


Economic graph with diagrams on the stock market, for business and financial concepts and reports


Abstract financial trading graphs on monitor. Background with currency bars and candles