


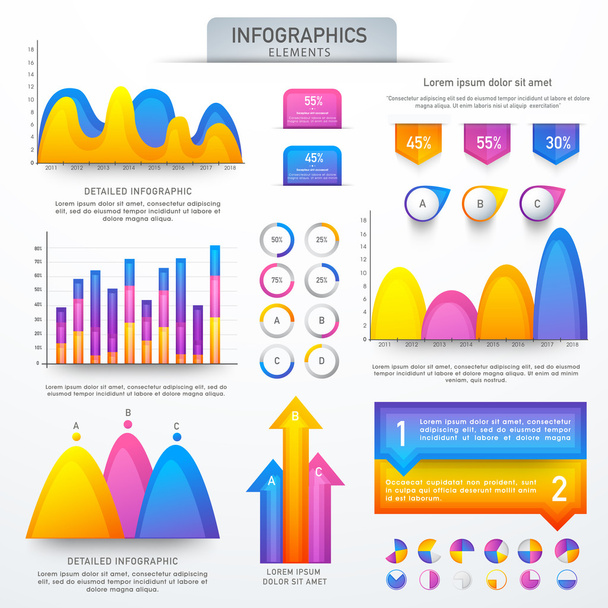

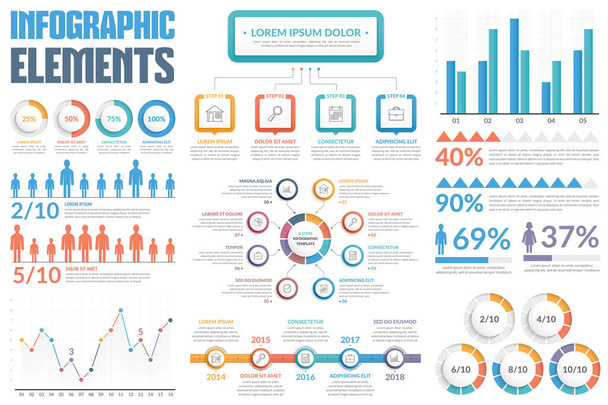
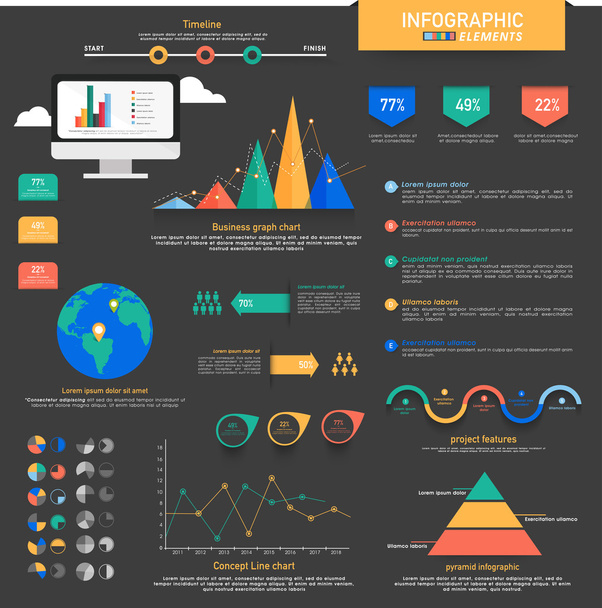
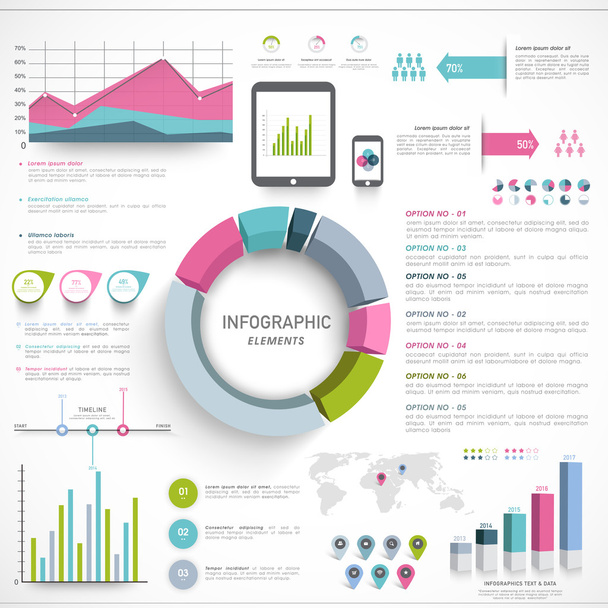
Большой набор креативных красочных инфографических элементов, включая статистические панели и графики для Ваших бизнес-отчетов и профессиональной презентации . - Векторное изображение
От alliesinteract 6900x6900 пикс
ID стокового вектора: 95098282
Бесплатно для использования в редакторе и скачивания.

Бесплатно для личного и коммерческого использования с обязательной ссылкой на источник.
Ссылка на источник после загрузки обязательна.

Похожие лицензионные векторы
Big set of colorful Business Infographic elements with statistical graphs for your professional reports and financial data presentation.
Colorful Business Infographic elements set with statistical graphs, charts, bar and world map.

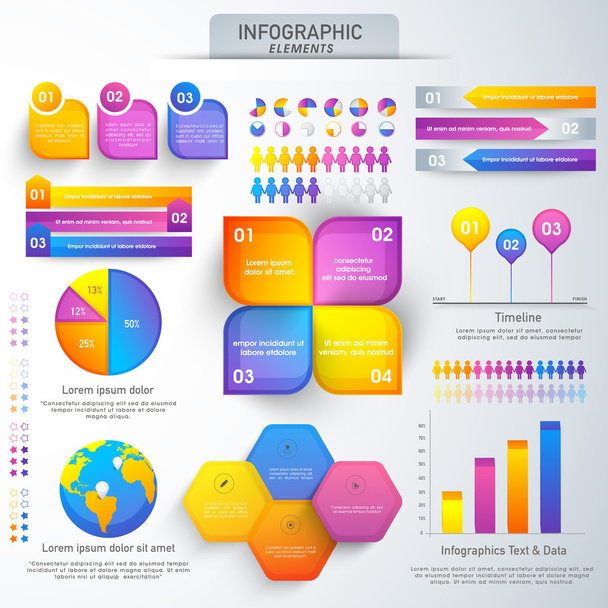
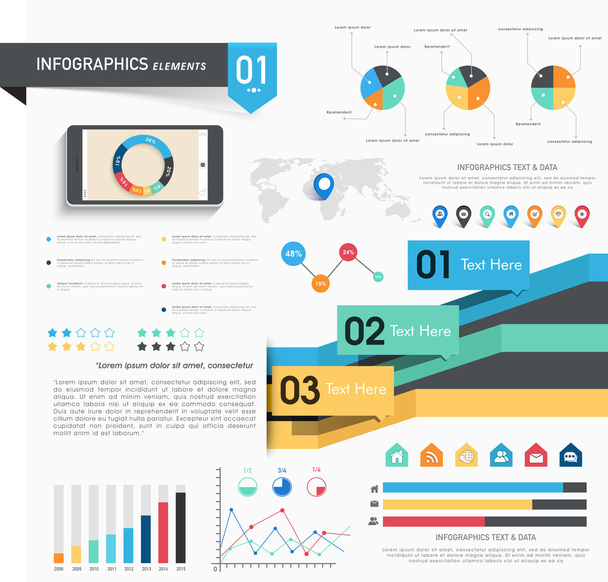
Bundle infographic UI, UX, KIT elements. Different charts, diagrams, workflow, flowchart, timeline, schemes, marketing icons, graphs and bars design template. Vector info graphic and infographics set.

Bundle infographic UI, UX, KIT elements. Different charts, diagrams, workflow, flowchart, timeline, schemes, marketing icons, graphs and bars design template. Vector info graphic and infographics set.

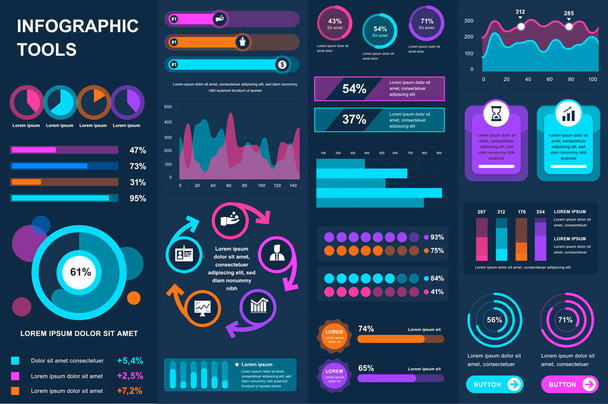
Bundle infographic UI, UX, KIT elements. Different charts, diagrams, workflow, flowchart, timeline, schemes, marketing icons, graphs and bars design template. Vector info graphic and infographics set.
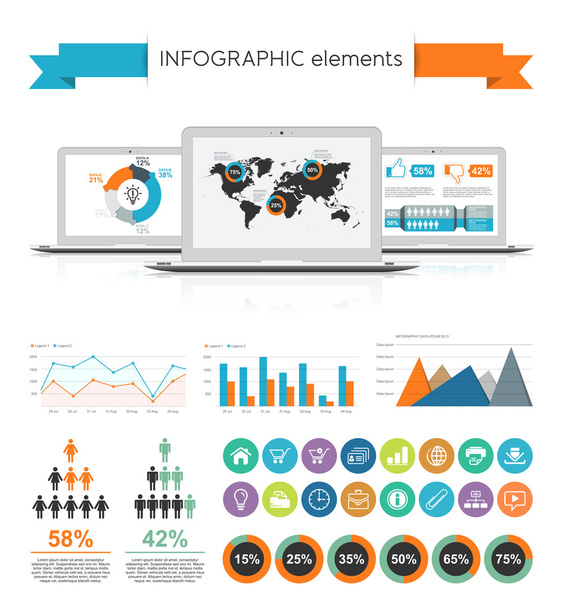
Infographic elements with three notebook devices with icon set and ribbon, in vector illustration
Больше от
alliesinteract

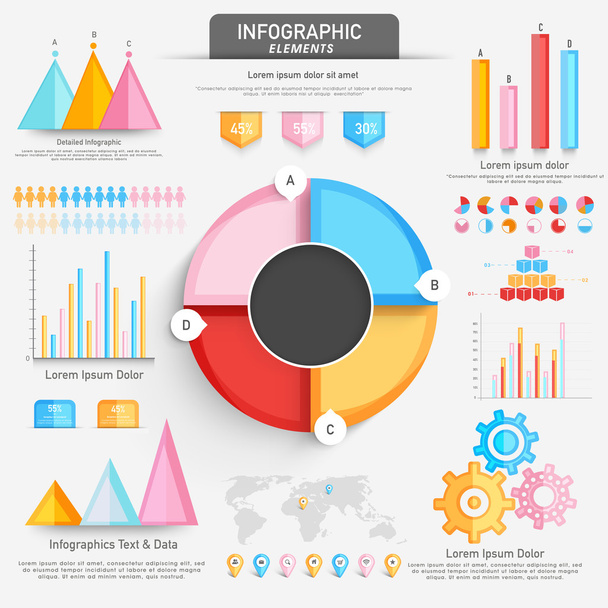
Creative infographic elements like graphs, bars and pie charts for business data presentation.
Big set of various statistical infographic elements for your financial growth and business reports presentation.

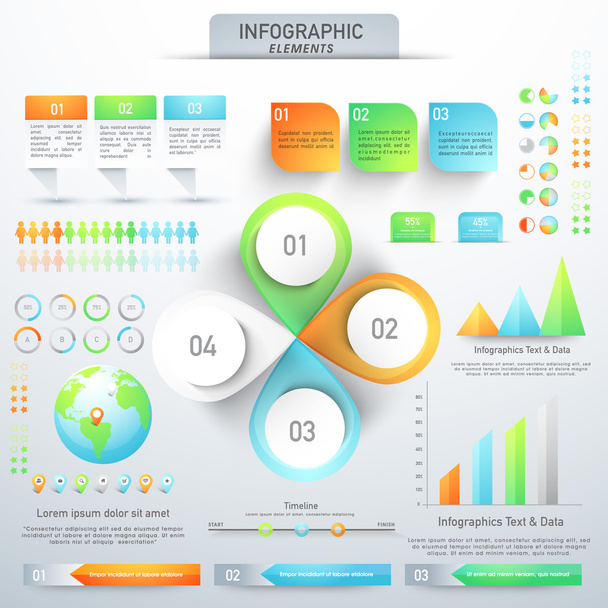
A big set of creative infographic elements with statistical graphs and charts for your business reports and presentation.

Creative Infographic elements set with various statistical graphs, charts and digital devices presentation for your business.

Big set of various statistical infographic elements for effective business reports and professional presentation.

A big set of Business Infographic elements with different graphs for presenting for financial growth.
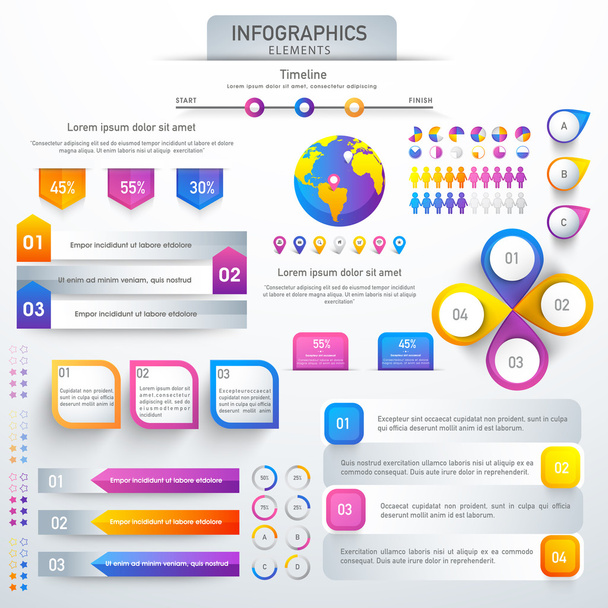
Various infographics elements sets to presenting your business growth and statistics.

