


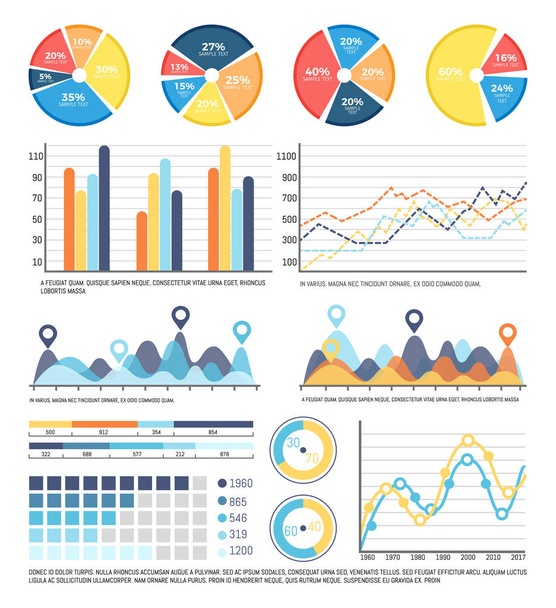
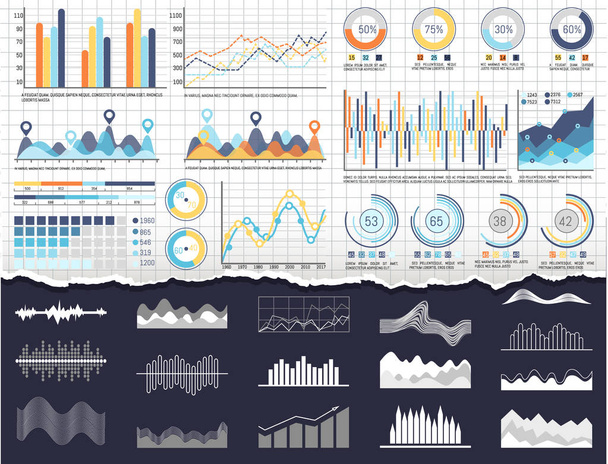
Diagram en infographics met segmenten en uitleg vector. Regeling met design, presentatie met gevisualiseerde bedrijfsconcepten. Statistieken ontwerp - Vectorafbeeldingen
door robuart 4594x4999 px
Stockvector ID: 231834386
Gratis te gebruiken in de beeldbewerker en om te downloaden.

Gratis voor persoonlijke en commerciële doeleinden met naamsvermelding.
Naamsvermelding na het downloaden is vereist.

Soortgelijke rechtenvrije vectors

Infographics and charts with curves, data analysis vector. Scheme and pie diagrams with segments and visualization of information. Business concepts

Infographic schemes and pie diagrams with numbers vector. Numeral information on visual layouts, statistics and data in flowcharts and growing charts


Data visual representation of business results vector. Flowcharts and graphics, schemes with scales curves in different colors. Visualize information


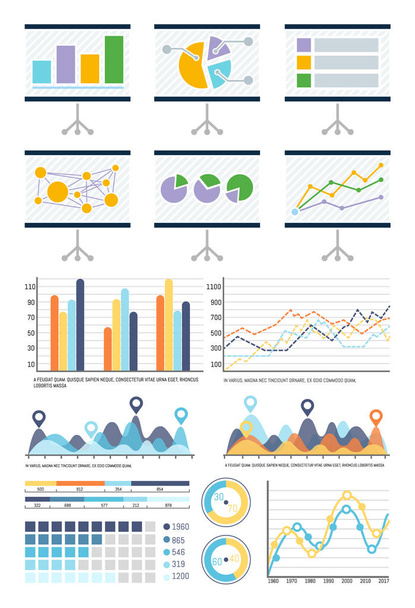
Infographics report on data received in research vector. Business information organized in flowcharts and infographs. Presentation of pie diagrams
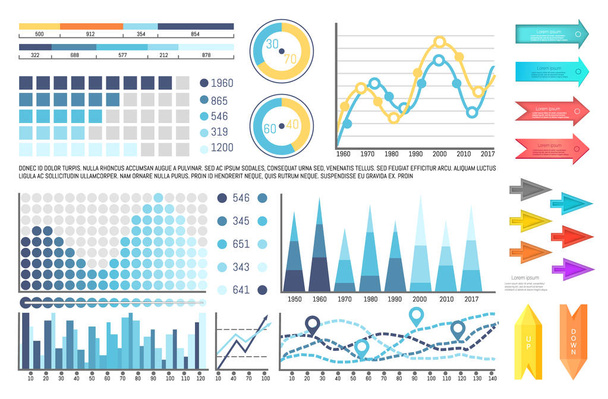
Infograph and pie diagrams, business concept vector. Graphic representation of data results. Set for infographics presentation of info in flowcharts and increasing lines

Infographic with timeline and numbers information vector. Schemes with percentage on pie diagram, charts with pointer and location signs, flowcharts
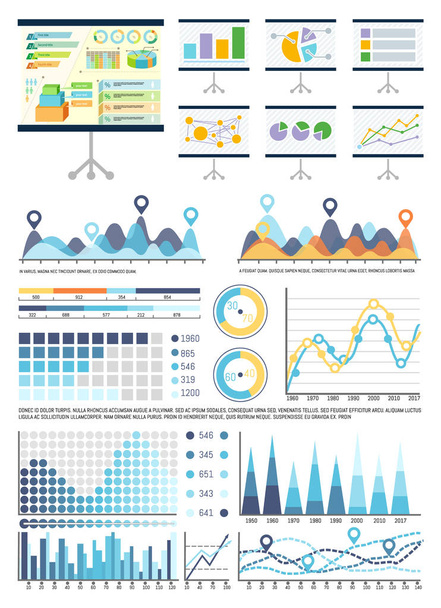
Whiteboard with infocharts and infographics data vector. Graphic representation of information, business conceptualisation. Flowcharts and pie diagram
Meer van
robuart
Infographics and flowcharts whiteboard presentation vector. Pie diagrams schemes of business visualized information. Board with infocharts and graphs

Infographics and charts with lines graphics vector. Dots and curves, visualization and conceptualization of data. Schemes and numeric figures results
Infographic and charts, business pie diagrams schemes vector. Visual representation of information, statistics of data, analyzing results flowcharts

Infochart with data, flowchart visual information representation vector. Diagrams and schemes, charts with falling and growing lines design results


Infographic with curves, increasing data results vector. Flowcharts with numbers scales, location pointers circles. Graphs and schemes visual layout

