Créer


Fonctionnalités
Ressources créativesTutorielsTarifs
Plus
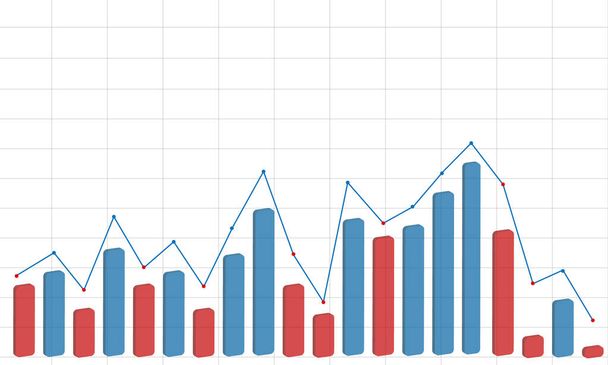
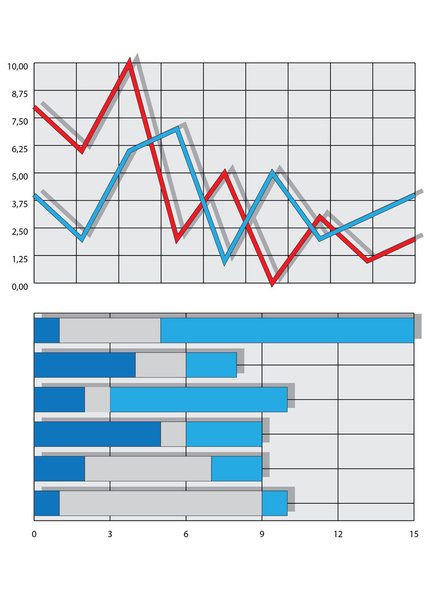
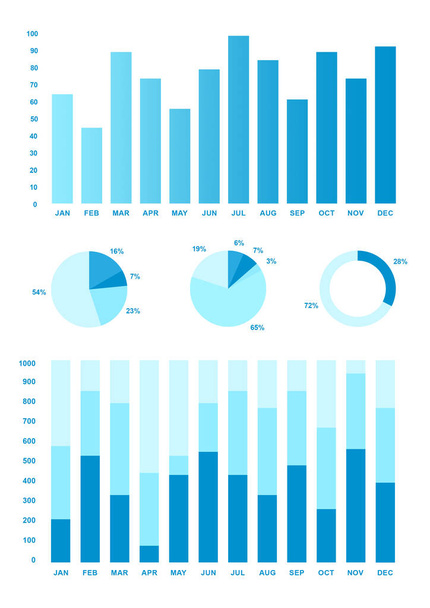
VistaCreateUnlimitedPhotosDifférents graphiques colorés avec des informations statistiques. Illustration


Différents graphiques colorés avec des informations statistiques. Illustration - Photo & image de stock
Par NewAfrica 3508x2481 px
Id. photo: 330430218
Ce site est protégé par reCAPTCHA.
Politique de confidentialité et de cookies et les Conditions d’utilisation de Google s’appliquent. de
Images libres de droits similaires

Dashboard UI infographic. Web presentation screen data graphs HUD diagrams, modern app interface. Vector graphic.

Vector illustration of business graph

Abstract business chart with uptrend line graph, bar graph and bull market stock numbers. Vector.


Stock exchange design, vector illustration eps10 graphic

Afficher plus


Tags de photo
Tableau
Blanc
Contexte
Coloré
Numéro
Graphiques
Élément
Illustration
Conception
Affaires
Croissance
Technique
Moderne
Symbole
Créatif
Concept
Écran
Numérique
Données
Document
Informations
Etape
Présentation
Site web
Finances
Modèle de modèle
En ligne
Rapport
Différents
Graphique 1
Graphique
Affiche
Économique
Option
Progrès réalisés
Bénéfice
Diagramme
Analyser
Visualisation
Exemple
Statistiques
Infographie
Infodiagramme