Social Media
Druck


Beliebte Features
Foto


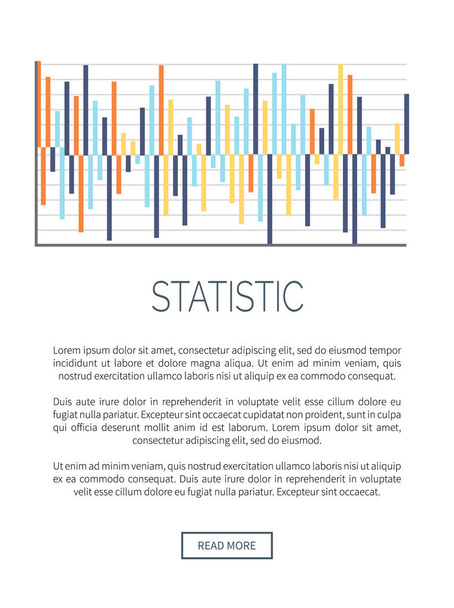
Statistische Darstellung für Webseiten mit bunten Balkendiagrammen. Vektor-Illustration für Website entwickelt und enthält Schaltflächen - Vektorbild
Von robuart 5160x4000 px
Stockvektor-ID: 175681630
Kostenlos zur Verwendung im Editor und zum Downloaden.

Kostenlos für persönliche und kommerzielle Zwecke mit Attributierung/Urhebernennung.
Attributierung/Urhebernennung nach dem Download ist erforderlich.

Ähnliche lizenzfreie Vektoren


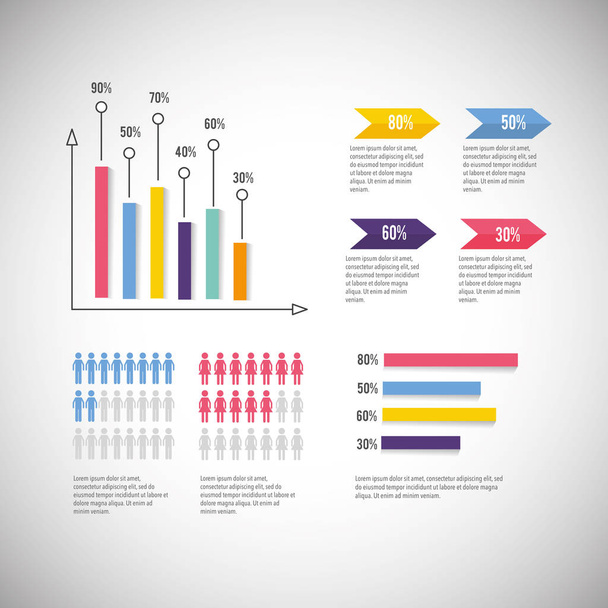
Infographic business diagram with information strategy vector illustration

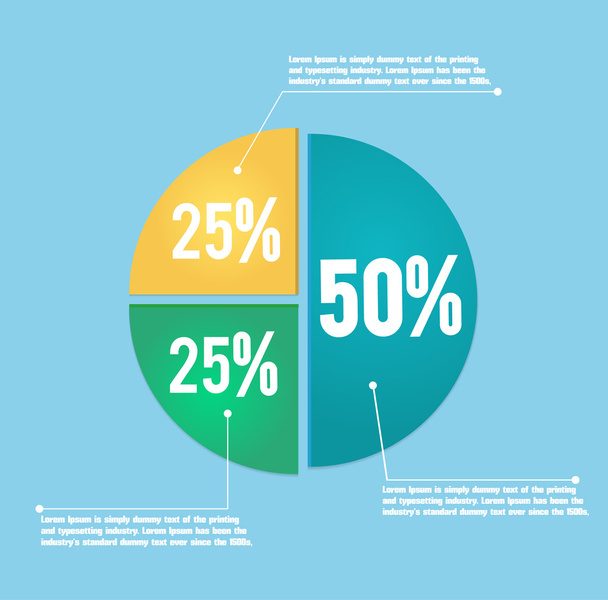
Isometric infographic business diagram information vector illustration

Mehr von
robuart
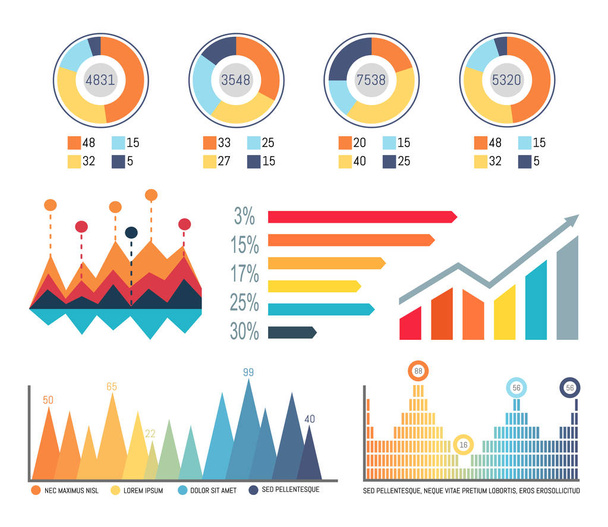
Infographics and diagrams, flowcharts information vector. Schemes of increasing results, conceptualization of received data. Numerical data statistics


Set of elements for wind infographics. Graphs and Charts show weather changing. Weather forecast concept. Strength of wind, tornado, hurricane. For website and mobile app designs. Vector illustration


Statistic web pages with text sample, infographics vector. Layout of visualized information, business data in comparison. Schemes and flowcharts plan